2.2 | Power BI
2.2.1 | Overview
Power BI from Microsoft is worldwide leading on the market for BI & Analytics platforms.1 The software allows the integration, transformation, modelling, visualization as well as the analysis of data from a large selection of different kinds of data sources. When creating an analytics solution with Power BI, a dataset is created based on which various reports, containing data visualizations, are developed and are finally shared with other people within an organization.
It is important to note that Power BI is a low-code tool. That means almost all functions (e.g. data transformation steps or formatting a visual) are operated with buttons, dropdowns and input fields on the user interface. This makes the tool very accessible for non-programmers like for example finance professionals who have a good understanding of how to work with data (e.g. also with Excel). However, it is still possible to work with code if desired or required for more complex topics. This makes Power BI a highly versatile tool. The exception is the creation of Measures (see step 4 below) which almost always requires the use of the DAX language.
Please note, I conciously omitted some of the additional elements and tools available in Power BI in order to reduce complexity and to focus on the essential components.
Downloading and using Power BI Desktop is completely free. A license is necessary to publish and distribute datasets and reports via the Power BI Online Service as part of the Microsoft 365 platform. Prices vary by region but they are around USD 10 per user and month as of the time of writing this text.
2.2.2 The Power BI workflow
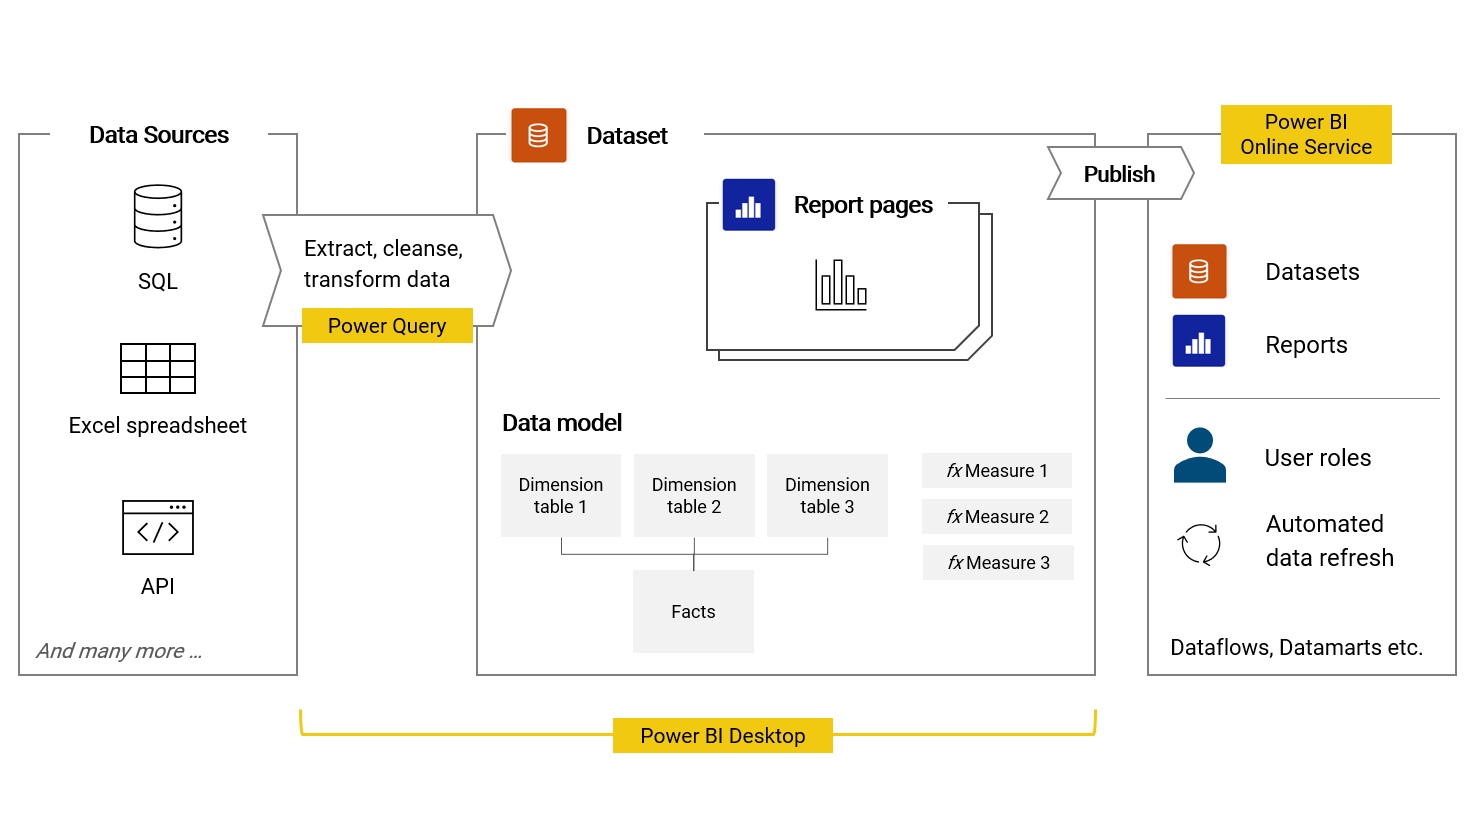
The workflow of creating a BI & analytics solution based on Power BI can be generalized as follows:
Create a new PBIX file with Power BI Desktop on the local machine / computer
Connect to one or several data sources and extract the required data. Currently, over 130 different kinds of data sources can be connected. These can be Excel spreadsheets, text files, SQL databases, APIs, entire file folders, ODBC, Power BI dataflows, Python scripts etc. 2
Using Power Query, which is a data transformation tool built within Power BI (and Excel), raw data is cleansed, prepared and modelled to the desired table structure required for the dimension and fact tables of the final data model
When the dimension and fact tables are prepared, they are connected with each other to an integrated data model in the modeling tool of Power BI
In the report builder, custom calculations - so called Measures - are created based on the functional language DAX 3
Further in the report builder, data visualizations are created and placed on the report page. Power BI offers a wide selection of different visualization types each with their specific options for formatting etc. What is more, filters can be placed on the report page, giving the end-user the possibility to filter the data as required
Finally, the dataset (containing the reports) is published to the Power BI Online Service in the Microsoft 365 cloud. For this, a Power BI Pro license is required for the person developing and uploading the dataset as well as for the people consuming the reports. In Power BI Online, various different user roles can be defined and allocated to people.
Finally, datasets can be configured to refresh data based on a time schedule (e.g. overnight)
Many things that are possible in Power BI Desktop can now also be done directly in the Power BI Online Service. Data can be loaded and transformed with Dataflows. Datasets can be created with Datamarts. And visualizations and reports can be created or adjusted directly in the Online Service. Furthermore, it is now also possible to create or change Measures as well as other components of a data model directly online.
2.2.3 Overview of the Power BI Desktop user interface
In the following, I want to give a quick overview of the Power BI Desktop user interface in order to make navigating the tool for you more easy in the following chapters.
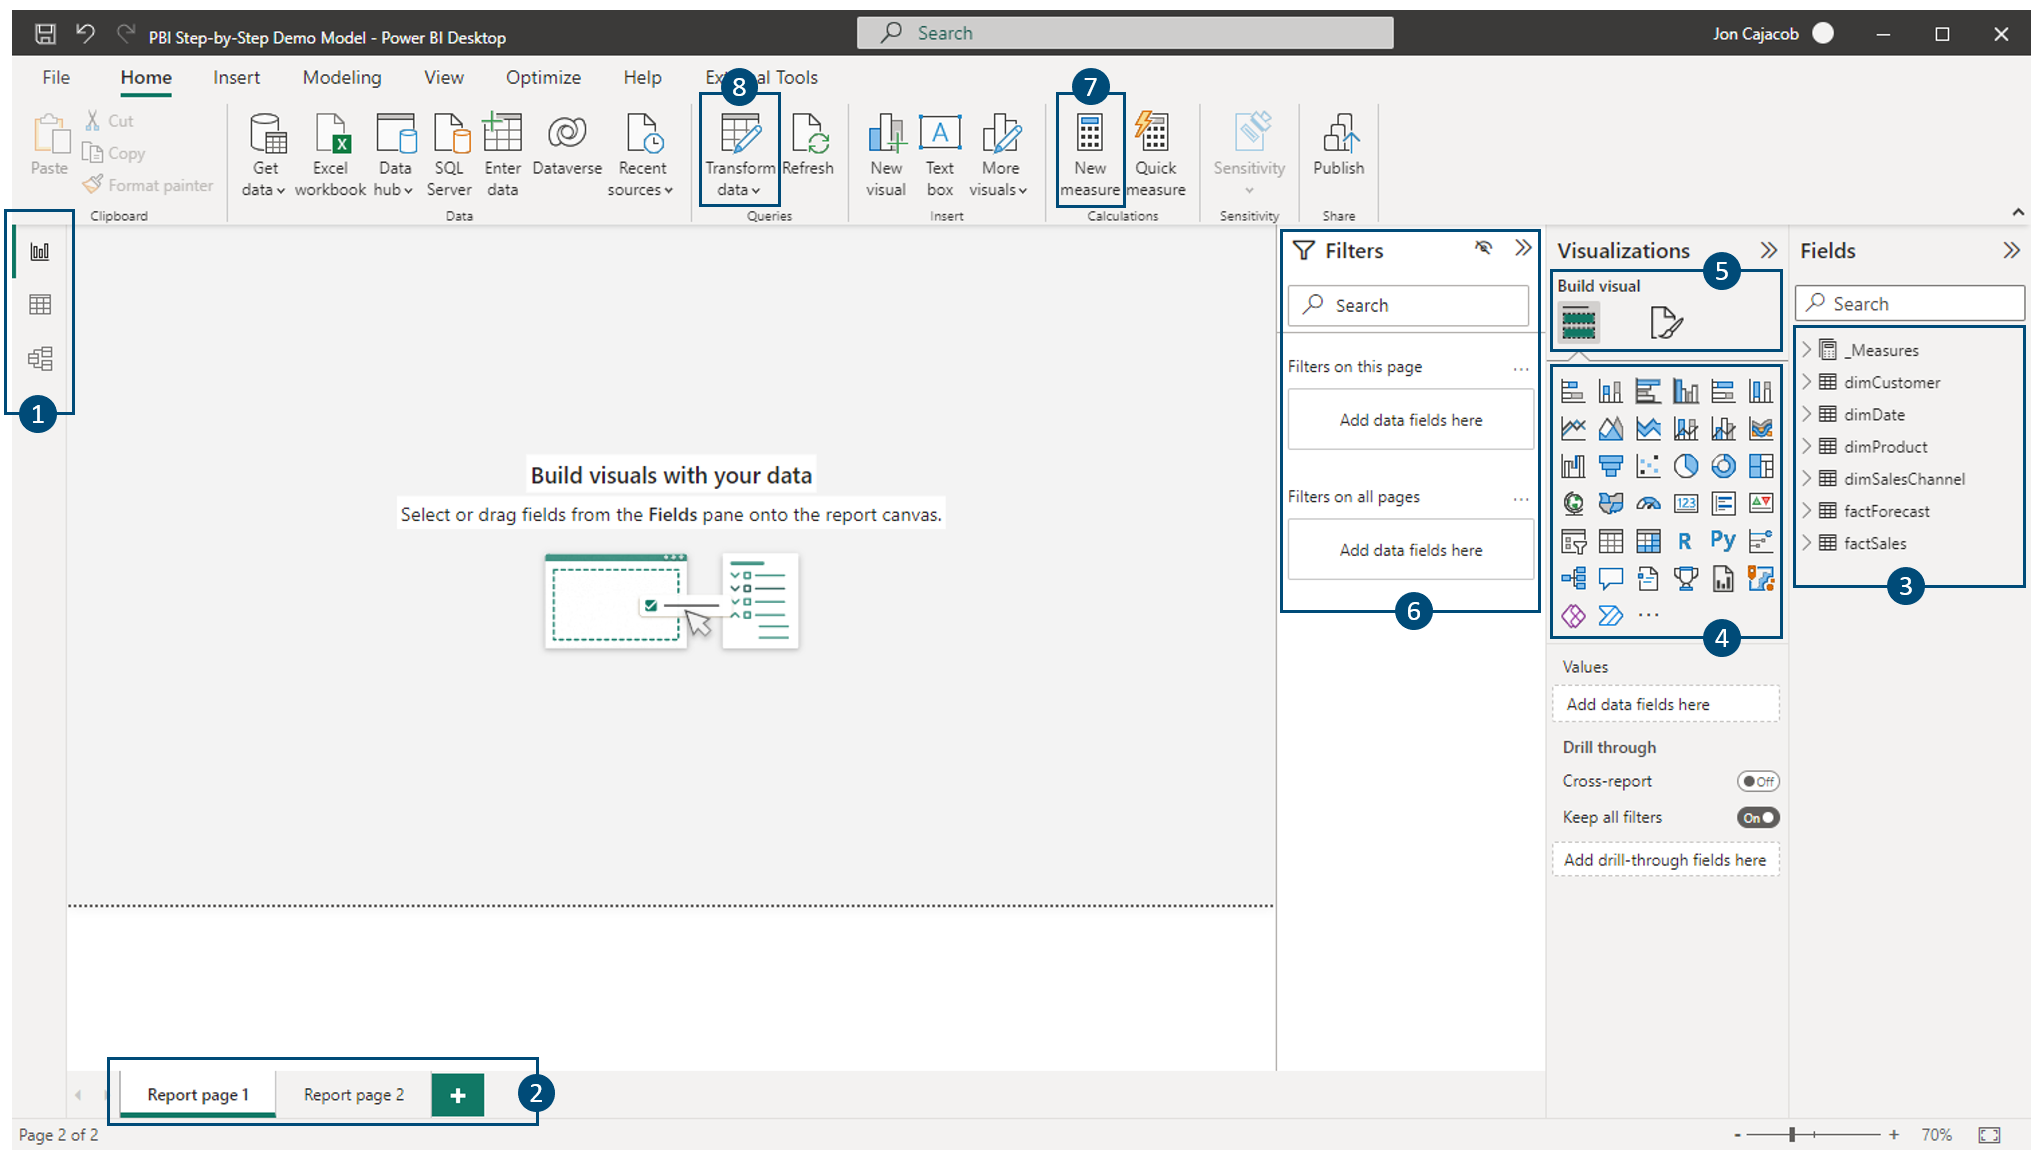
Description
- Navigation between the report builder, table explorer and data model (from top to bottom)
- Report pages, similar as in Microsoft Excel
- Tables, fields and measures used to build visuals and populate filters
- Selection of visualization types (clicking on one creates a new visual on the canvas)
- Switch between field placement in a visual (left) and formatting options (right). A visual has to be selected on the canvas to see the configuration options for it here
- Drag-and-drop of fields to set the pre-filtering of visuals, report pages and the entire report
- Creation of a new measure
- Open Power Query editor
2.2.4 A few words about competing BI software
[in progress]
- 2022 Gartner Magic Quadrant for Analytics and Business Intelligence Platforms↩
- See here for the full list of currently supported data sources: Supported Data Sources↩
- DAX - Data Analysis Expressions; Documentation: DAX Reference↩