2.3 | Power Query
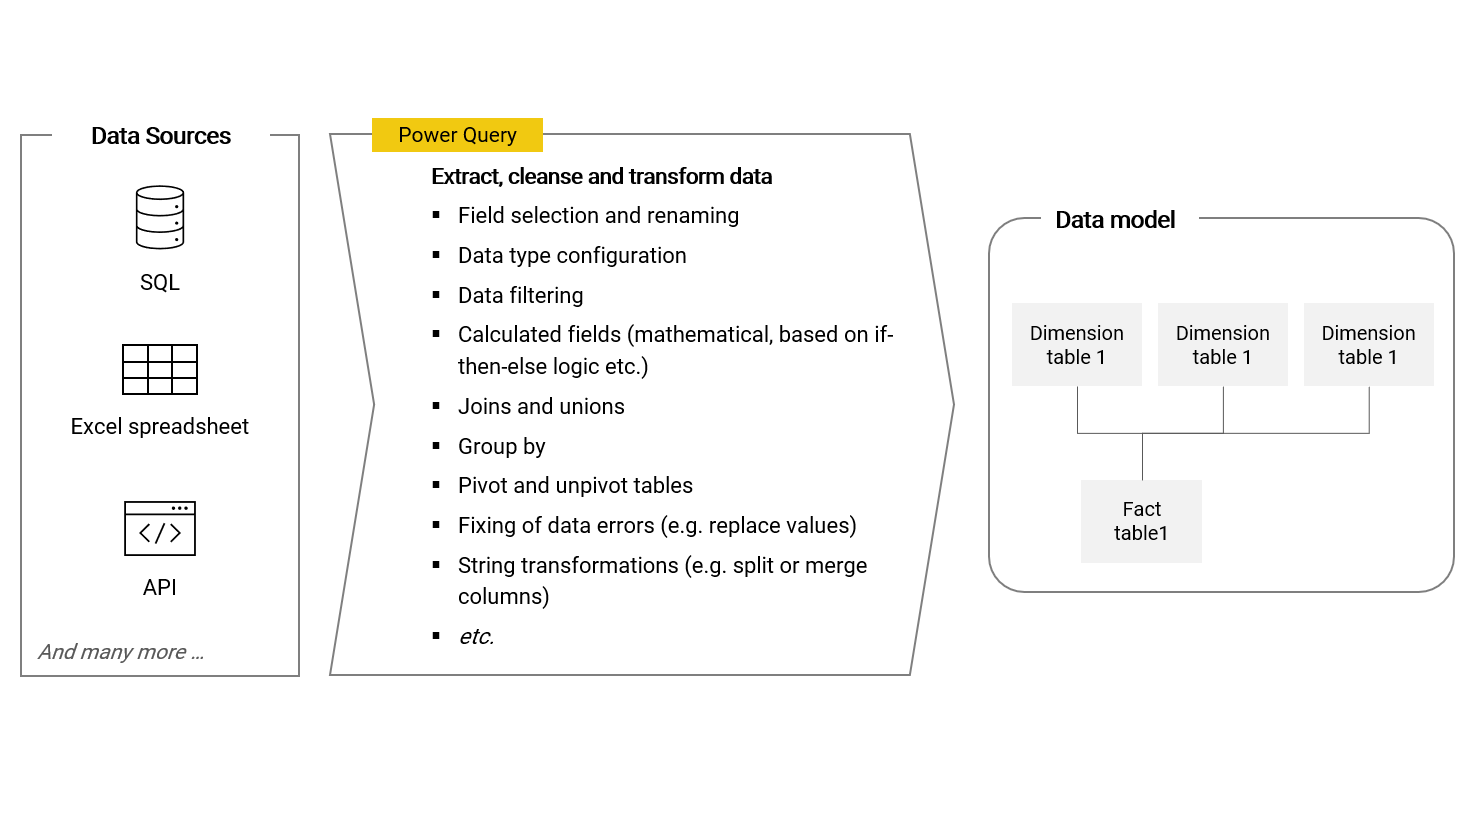
Power Query is a data transformation tool built into Power BI and Microsoft Excel. With Power Query, we can connect with various different data sources, extract required data and transform and load it into tables (dimensions and facts) which can be used to build the data model. This automated process is generally referred to as "ETL", whichs stands for extract, transform and load. Preparing data is necessary and important because data in its raw form stored in data sources is rarely in the shape required for a business intelligence solution and its data model architecture.
Power Query is considered a very powerful tool not just because of its breadth of functionality, but also because it is low-code like Power BI itself and most features are accessible via buttons, dropdowns, guided settings windows and input fields on the user interface. When a data transformation step is applied to the data table, code is generated in the background. It is always possible to directly work with and adjust this code if required, hence giving the user maximum flexibility. Further, for each table I can always easily follow the transformation steps and see intermediate results (see bullet number 4 below).
In the example use-case of this book, we will go through many of the most important data transformation operations available in Power Query. For now, as for Power BI Desktop, I want to give an overview of the user interface.
2.3.1 | Overview of the Power Query user interface
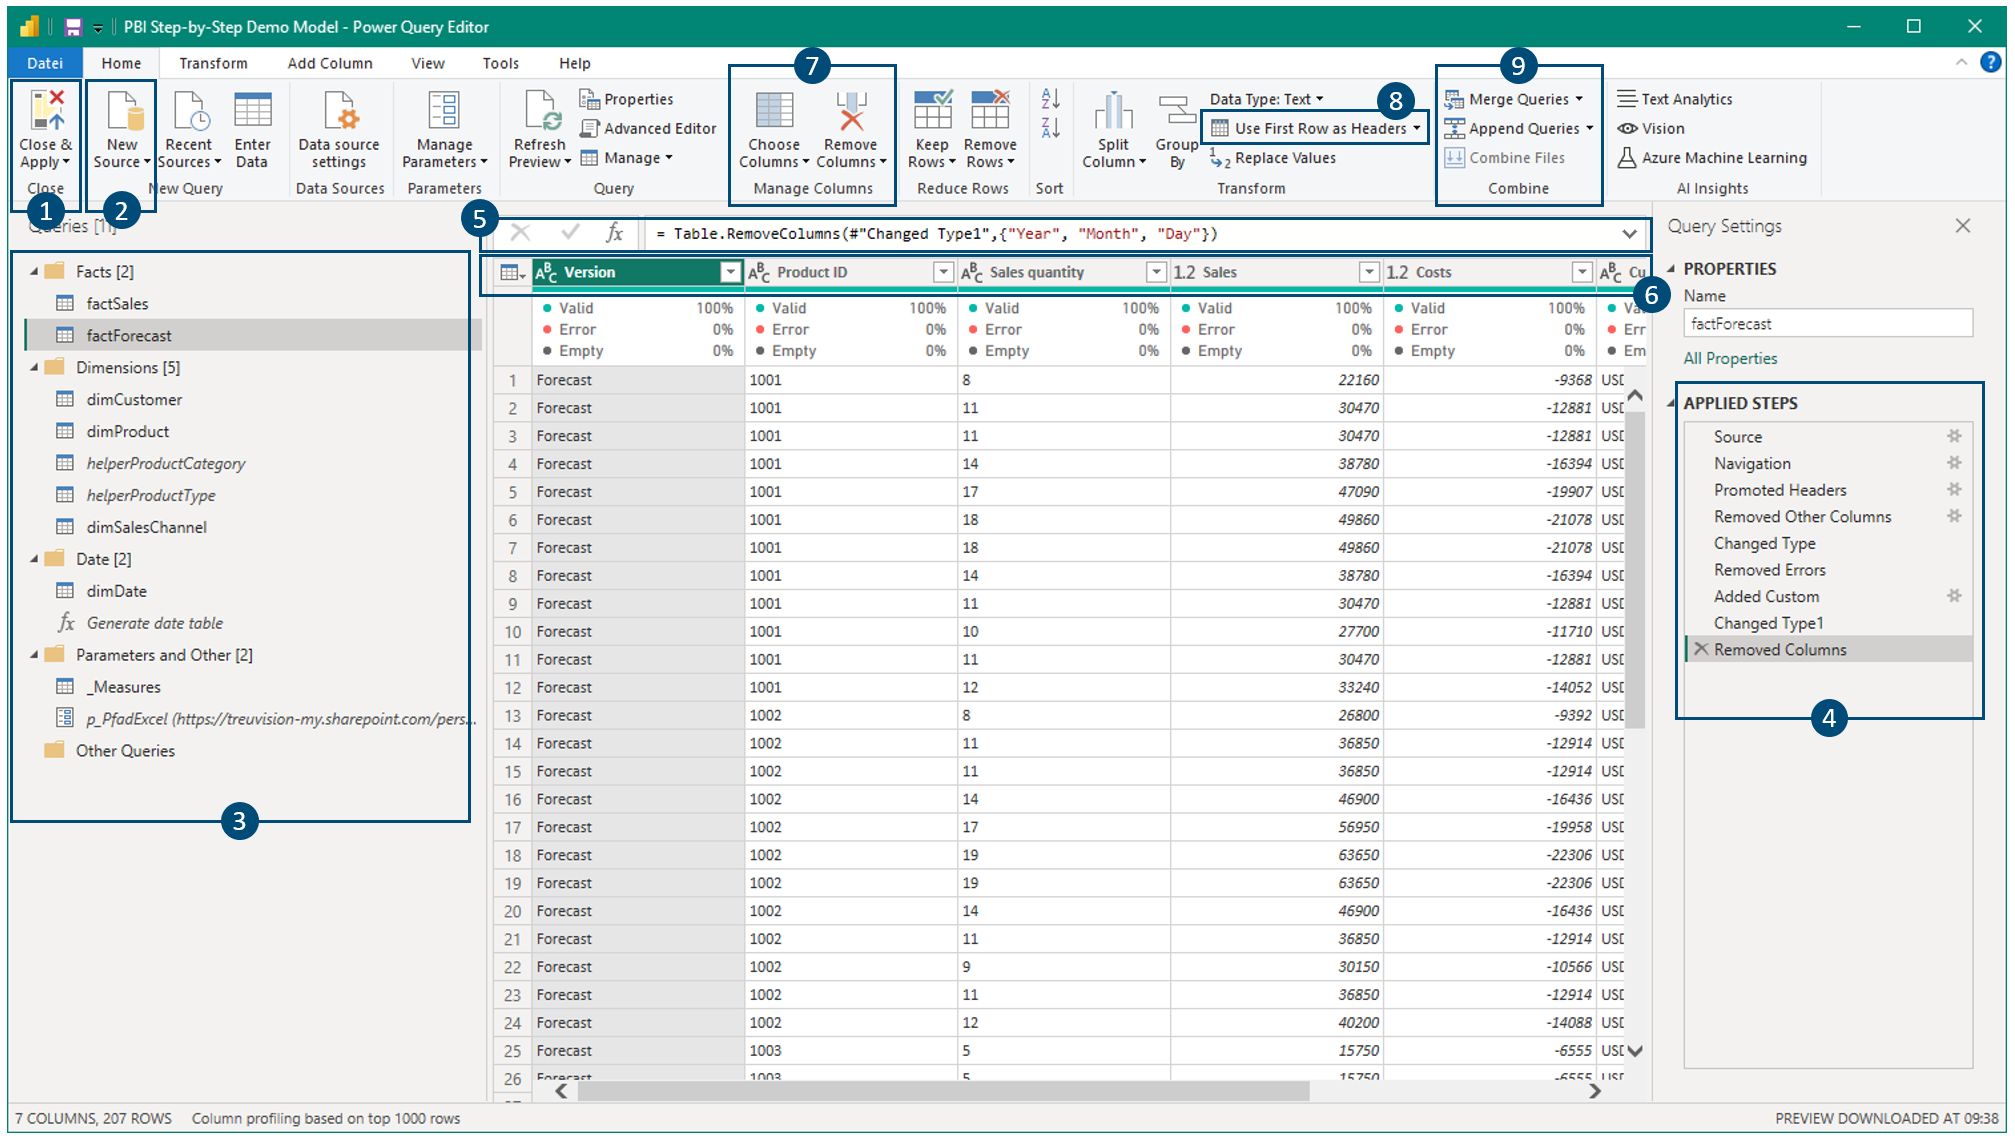
The following screenshot shows an overview of the Power Query interface. Please note, all important elements are covered later when building the model based on the demo data.
Description
- Changes to the data transformation process in Power Query have to be applied to the data model in order for them to take effect
- Connect with a new data source
- Navigation between the different queries (i.e. tables which can be intermediate tables in the transformation process or final tables being loaded to the data model)
- Data transformation steps of the currently selected query (from top to bottom). Click on a step to see the intermediate transformation results. New steps are always added right after the step that is currently selected
- Formula bar showing the functional code of the currently selected transformation step. The formula language is called M 1
- Table headers which is the place to apply filters (as in Microsoft Excel), change data types, rename headers or apply various transformations via right-click
- Selection and removal of columns
- Promote the first row of a table to be the headers
- Join (merge) and union (append) multiple queries
2.3.2 | Recommended order of data transformations
When we transform data step-by-step, there is a certain (generalized) order of steps that should be followed. In particular, it is best practice to reduce the amount of data to the scope needed as early in the process as possible. Therefore, I recommend the following generalized order of data transformations to be applied to a table:
- Promote the top row to become the table headers
- Select the columns needed (remove the ones not needed for the BI solution)
- Filter the table for the rows needed
- Define the data type of each column (dates to type date, numbers to type decimals etc.)
- Aggregate (group by) rows (only rarely necessary though)
- Union with another table
- Cleansing of data (replace values, removing errors etc.)
- Pivot / unpivot columns
- Create custom calculated columns
- Remove duplicate values in key columns
Please note, each ETL process has its unique requirements and of course the order just presented cannot be put in place 1:1 in most cases. But it can be used as a helpful reference.
2.3.3 | Using the right data types for table columns
An important part of any ETL process is to define the data type for each column of a data table. This is necessary to make sure any calculations based on the table columns and relationships between tables work in the intendend way. Further, we want to store data in an efficient way in the data model.
Power Query offers the following data types options:

There is a rule I strictly follow when defining data types and it goes as follows: Everything has to be the data type "Text", except numbers we want to perform calculations with and dates. This is a simple rule that can be applied to almost all use-cases and I certainly did so when implementing dozens of BI solutions.
The crucial thing to note is that when a column only contains numbers but we do not want to perform any sort of calculation with it - this is for example the case for any "ID" column containing numerical IDs - it has to be the data type text. The reason is simple: Often times ID columns are used to link tables with each other and we want to 100% sure, that these keys are interpreted in the right way. I have seen cases of IDs like '001' and '0001' in source systems. When defining such a column as a numerical data type, it will be interpreted as '1' in both these cases, although they are actually not the same and a table relationship using this ID would be ambiguous accordingly.
- Power Query M formular language documentation: M Documentation↩