4.2 | Building the data model
Building the data model means connecting the prepared dimension and fact tables via table relationships. As described in chapter VERWEIS, the most common data model schema by far in practice is the star schema model. And as such we will structure our model.
To get started, navigate to the Model view in Power BI via the navigation on the left border of the window:
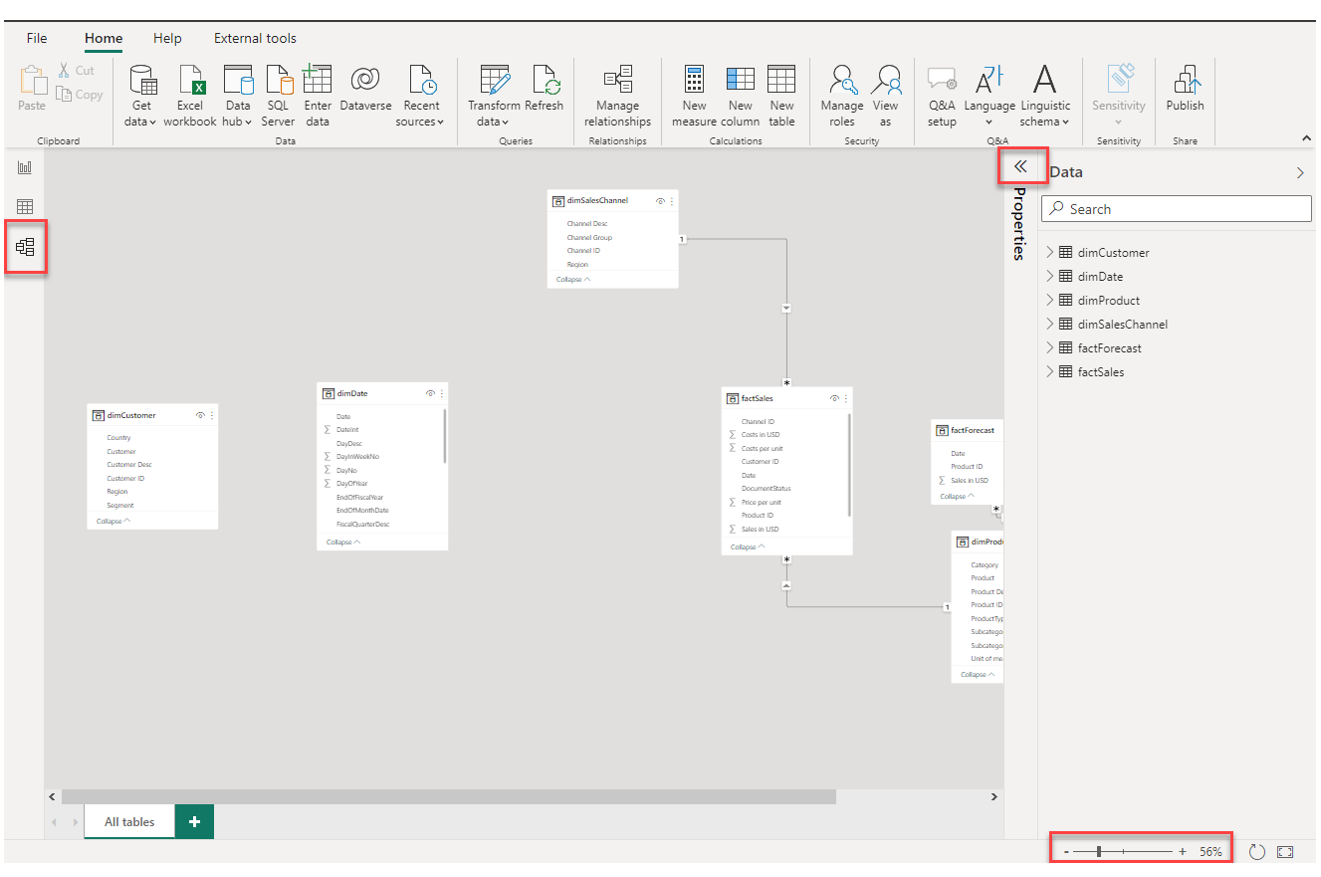
Depending on your screensize, zoom out or in to see all the tables we loaded to Power BI. In the screenshot above, I have further hidden the Properties pane to have more space.
Each box on the canvas represents a table with its fields listed within. If you have not changed the default settings of Power BI, there will likely already be some table relationships which Power BI created automatically based on matching column names. Please note, the automated creation of table relationships is a feature that can be deactivated in the options of Power BI.
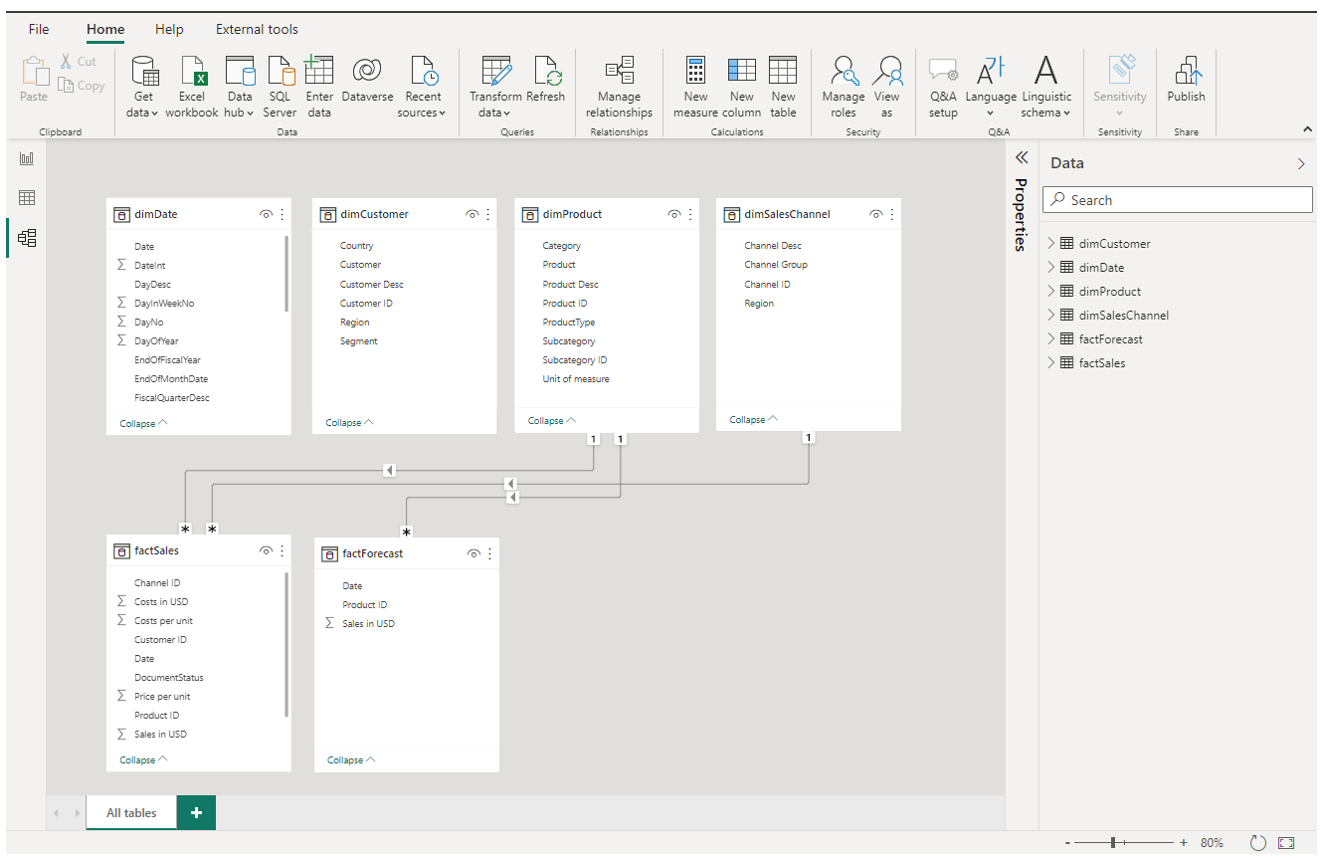
You can drag-and-drop the tables and arrange them on the canvas. I would suggest the following arrangement where dimension tables are on top and the fact tables just below:
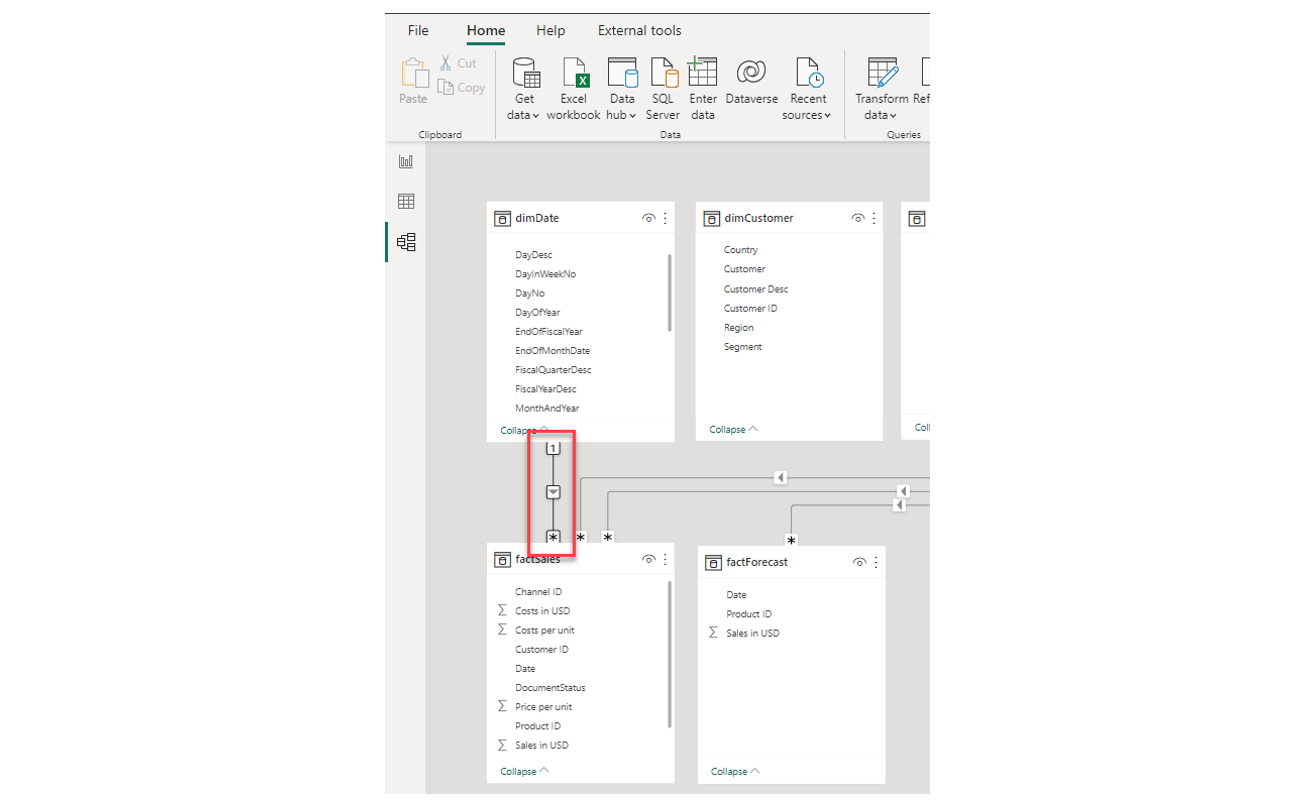
Then, we will create the missing table relationships. Doing so is very simple: Drag-and-drop a field from one table to the matching field on the other table with your mouse.
Let's start with connecting dimDate with factSales. Drag-and-drop the field Date from dimDate to Date in factSales. A line should be created with a "1" at the end of dimDate and a "" at the end of factSales*. Remember, each entity in a dimension table (here: dates) is unique (hence "1") while it can occur many times in the fact table.
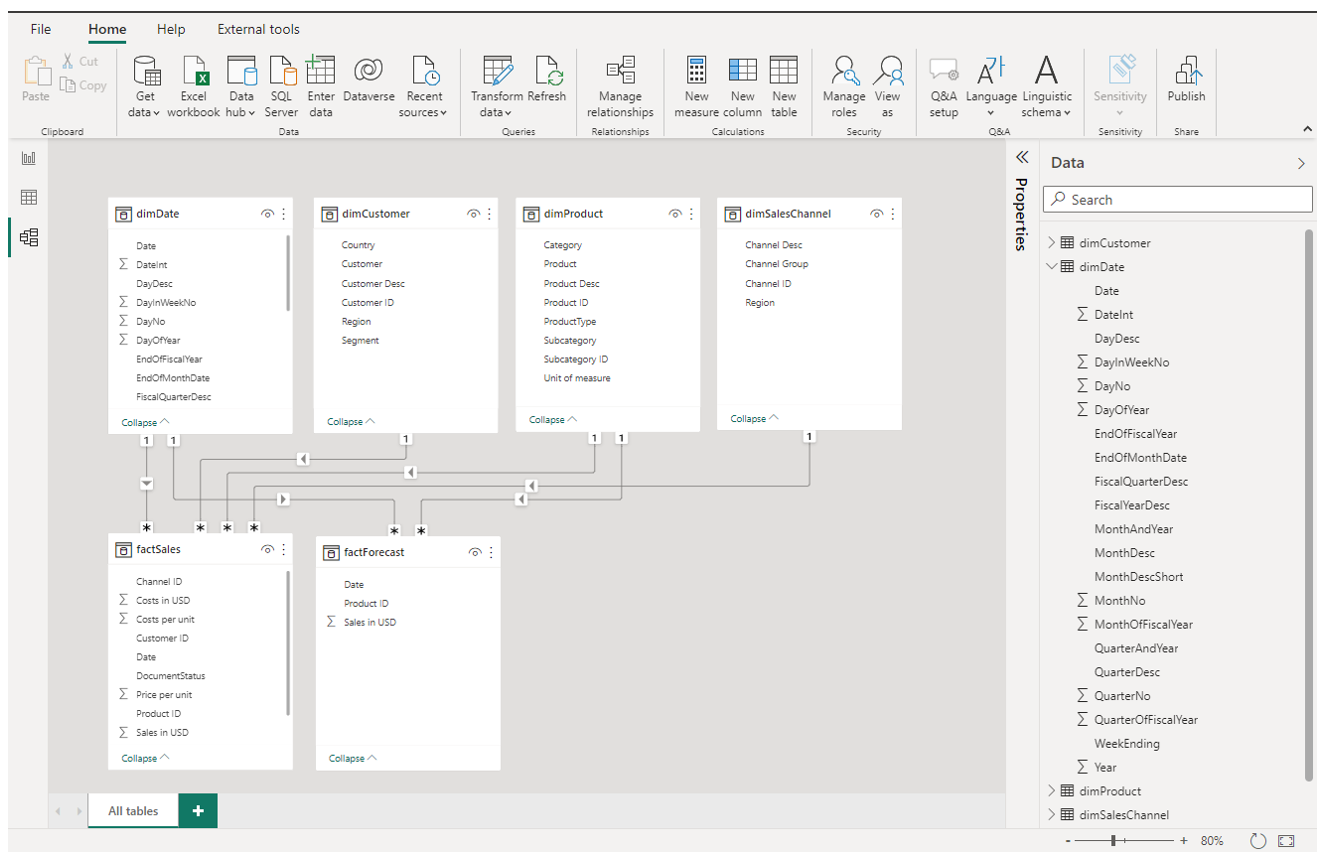
Now that you know how to create a table relationship, we can establish the rest of the missing ones:
- dimDate: Connect with factForecast via Date
- dimCustomer: Connect with factSales via Customer ID
Finally, your data model should look like the following:
Let's take a minute to understand why we are connecting the dimension and fact tables. Remember, we need the dimension tables to filter, slice and aggregate the fact data. In order for that to work, Power BI needs to "know" that there is a relationship between these tables and for example dimCustomer is there to filter factSales by the customer master data (like customer name, region or country). Each table relationship in Power BI has two important properties: cardinality and filter direction.
To configure the table relationship properties, either do a double-click on an existing connection line or a right-click and select Properties.
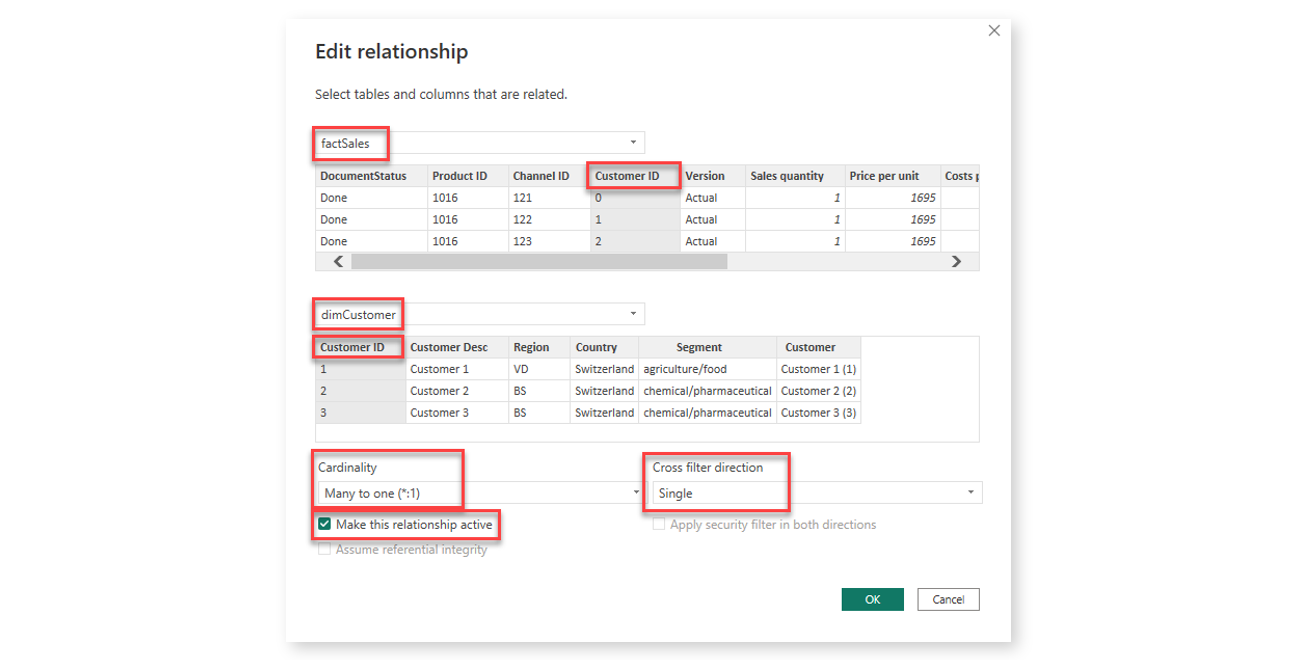
In this configuration window we can edit the matching table fields of both tables, the cardinality (here "Many to one (*:1)"), the cross filter direction and whether the relationship should be active or not. Please note, in almost all cases, the filter direction will be the dimension table filtering the fact table (and you should avoid other configurations).
Avoid cross-filtering configurations with the direction setting on "Both" as this will very likely lead to unexpected and confusing results in the visualizations and dashboards.
Now that we have built and understood the table relationships, let's look at some of the data model properties in the next chapter.