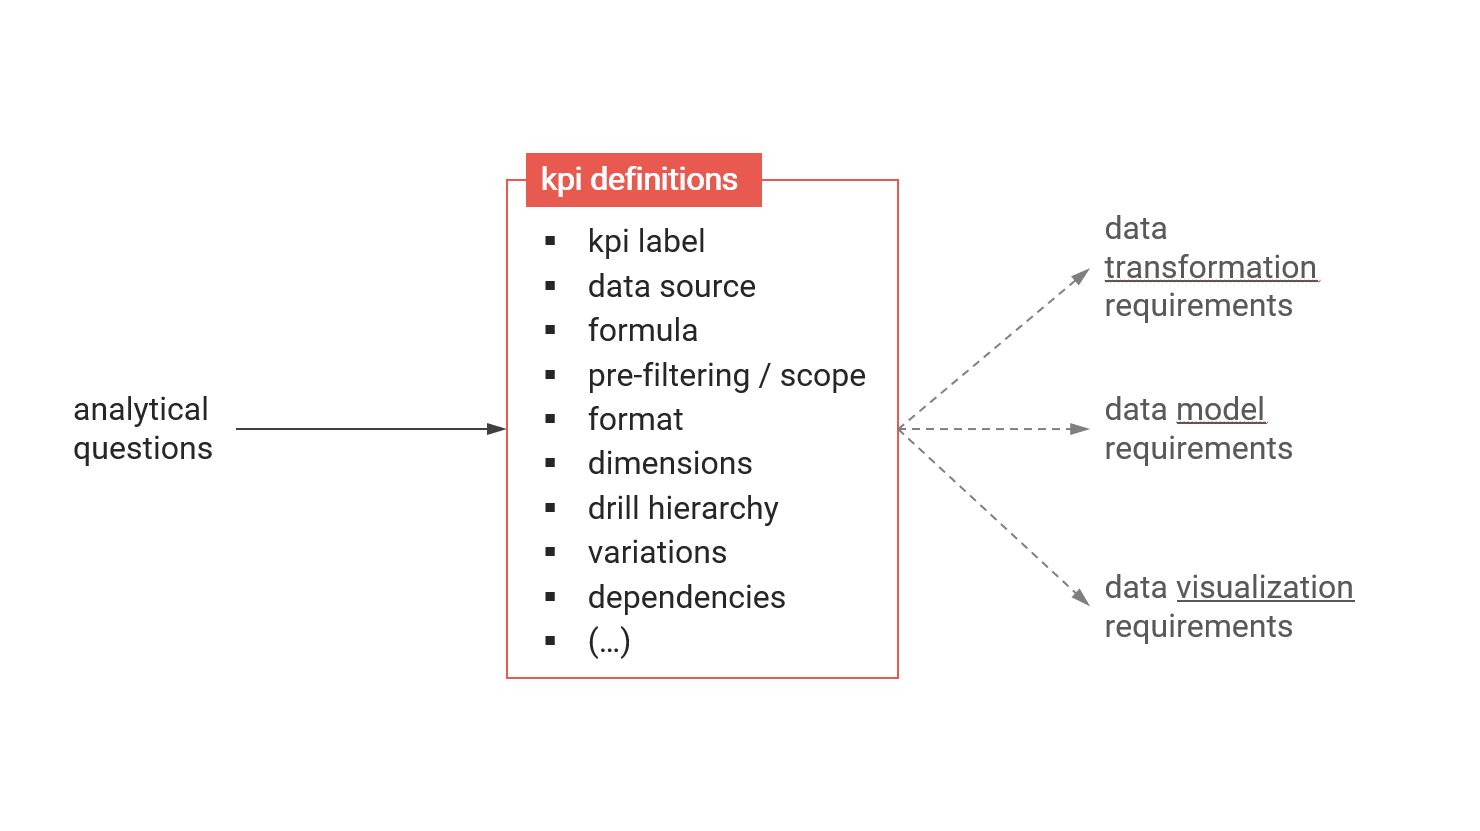
/// Key performance indicators are the core of each BI solution and should therefore be defined clearly. A simple template to list KPI definitions can be a valuable and central tool in the agile BI project for the entire team including the customer.

Introduction
The purpose of a business intelligence (BI) solution is ultimately to answer business critical questions and with that to support (data driven) decision making. The multidimensional analysis of key performance indicators (KPIs) is at the core of this purpose.
It therefore makes sense to clearly list and define KPIs already in the early beginning of a BI project using a simple template. In the course of the (agile) project, this list of definitions is then continuously updated and extended.
Analytical questions as the starting point
Which KPIs should be part of a BI solution depends on the analytical questions, which have to be answered.
Examples
- What are our top 10 products based on sales volume?
- How does the contribution margin of the current period compare to the previous period?
- Which sales area had the strongest growth based on order entry in the past 6 months?
Based on a catalogue of analytical questions, we can immediately derive necessary KPIs and their dimensionality.
Template: KPI definitions
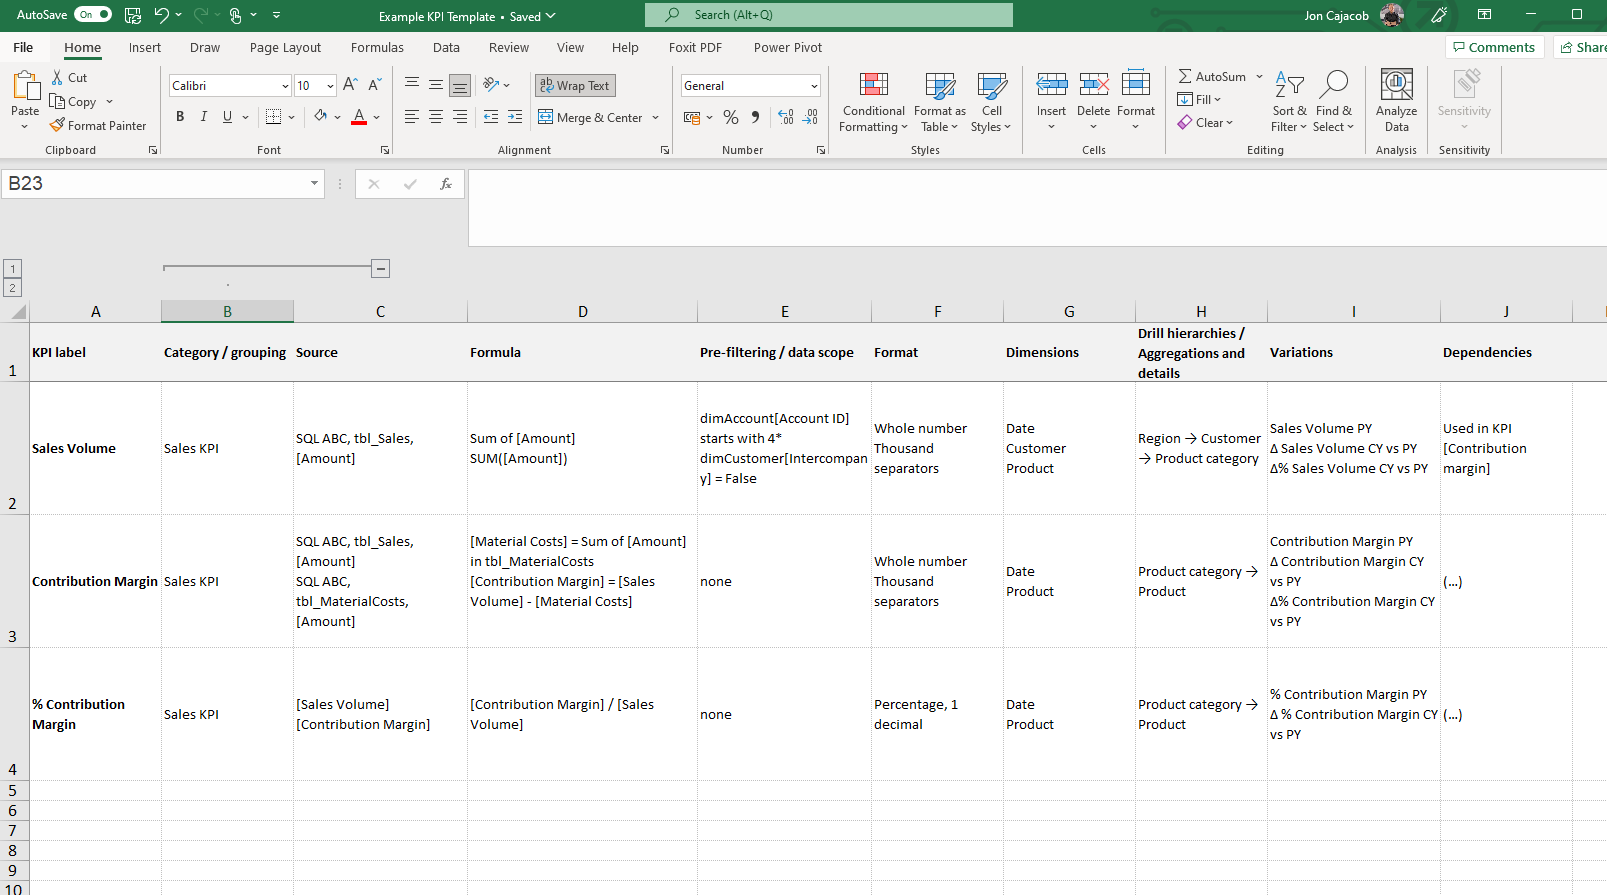
The list of KPI definitions is a working instrument at the core of the BI project management and is updated in the course of the project as requirements get more clear.
I recommend using a simple Excel spreadsheet which can also be shared within the project team (e.g. via MS Teams).

Features of a KPI definition
| Feature | Description | Example |
|---|---|---|
| KPI label | Ideally short, descriptive and structured | Sales Volume |
| Category / grouping | If useful: Grouping of KPIs for a better overview | Sales KPI |
| Source | Source system, table, field | SQL ABC, tbl_Sales, [Amount] |
| Formula | Description of the calculation. Can be done mathematically, in text or even directly with DAX | Sum of [Amount] or SUM([Amount]) |
| Pre-Filtering / Data Scope | Many KPIs require pre-filtering of the underlying data table by certain attributes in order to comply with the KPI definition | dimAccount[Account ID] starts with 4* dimCustomer[Intercompany] = False |
| Format | The format of the KPI is often times self-explaining. Sometimes though it is necessary to specifically define it | Whole number (0 decimals) and thousand separator |
| Dimensions | Based on which dimensions should the KPI be analyzed? (+ are there dimensions, based on which the KPI cannot be analyzed?) | Date (calendar) Customers Products |
| Drill hierarchies (aggregations and detail levels) | On which aggregation levels and until which detail level shall the KPI be analyzed? What is the order of aggregations through which the user can drill? | Region → Customer → Product category |
| Variations | Very often it is necessary to have variations of a certain KPI. For example the previous-year value of the KPI for a delta analysis. It is for a better overview to not list these variations separately in the KPI definitions. | Sales Volume PY Δ Sales Volume CY vs PY Δ% Sales Volume CY vs PY |
| Dependencies | KPIs often depend on each other and are sometimes even part of a bigger KPI tree. It is therefore important to note these dependencies (also see: DRY principle) | Used in KPI [Contribution margin] |
Conclusions
In my experience, a detailed project or solution documentation rarely provides the value that one hopes for. Requirements and implemented elements change far too fast to keep track of and with modern BI tools, the documentation can be done directly inside the tool. Be it commentary in complex KPI calculations (e.g. with DAX) or descriptions of transformation steps in the ETL (e.g. within Power Query).
A list of KPI definitions however, requires little effort but brings extensive value in the course of the project as KPIs are the core of any BI solution. From the KPI definitions we can immediately get a better understanding of how the solution should ultimately look like and easily derive requirements for the other building blocks of the tool. Which dimensions are needed as part of the data model? Which facts are needed on which detail level? etc.
Why not give it a try in your project?
