
/// Key performance indicators (KPIs) are at the very core of each analytics solution. It is very common to have a high number of variations of KPIs required to be implemented in such a tool, e.g. variations based on time (current year, previous year, YTD etc.). Further, KPIs are often interlinked and build on each other in KPI trees. The DRY-principle (don’t-repeat-yourself) is a method to make sure this big number of defined KPIs in a solution is properly managed and organized. Specifically, calculation logics are only ever defined in one place. Variations of KPIs and dependable KPIs always reference back to this original definition and nothing is ever repeated.
Introduction
In every BI & analytics project, KPIs are a crucial element of the solution. They have to be defined and then implemented in the tool accordingly, applying specific logic and most of the time mathematical calculations.
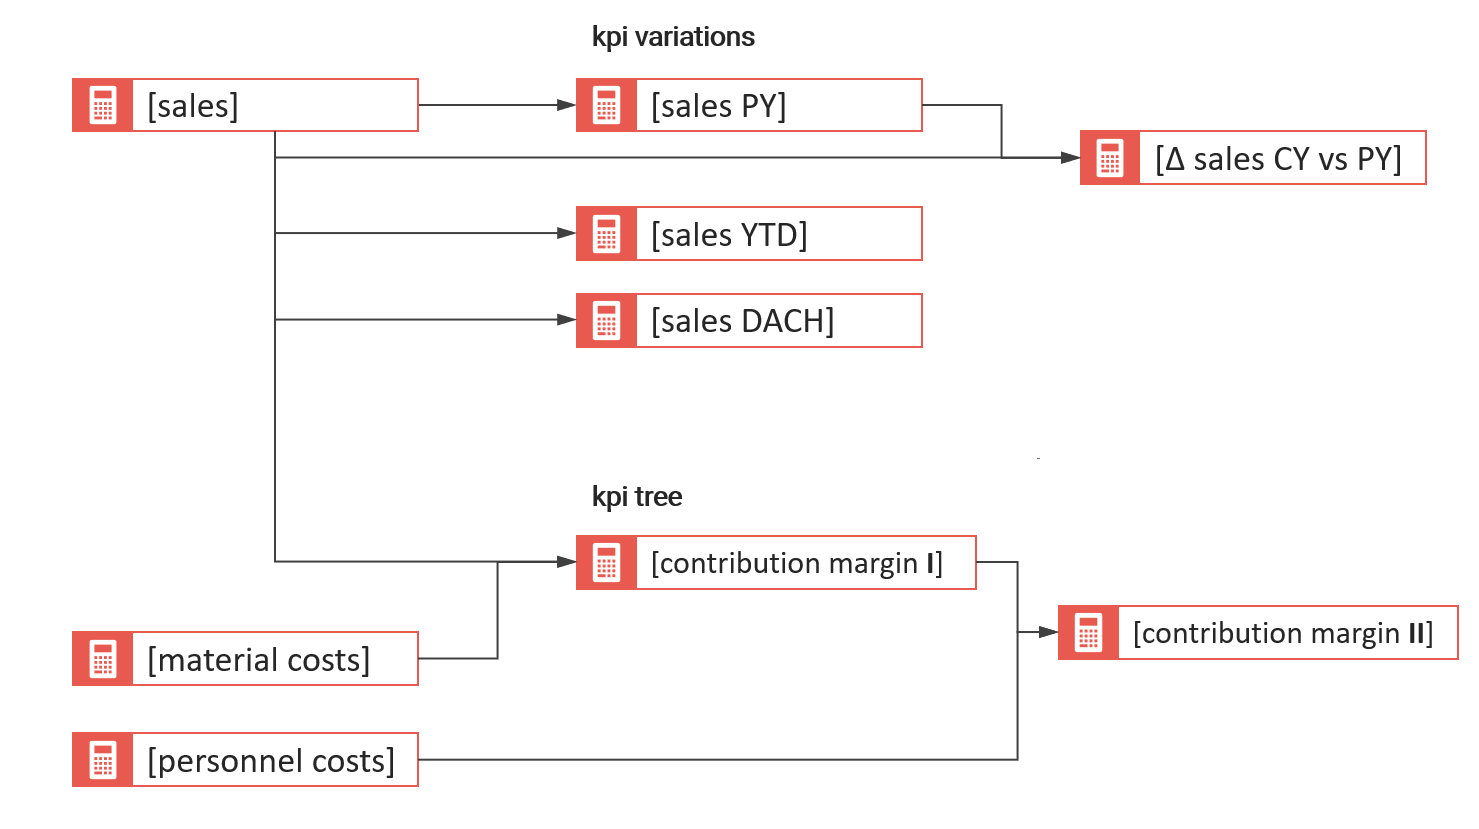
It is not uncommon for the sheer number of different KPIs as part of an analytics solution to be quite high. This is mostly driven by numerous variations a certain KPI has in the BI tool based on customer requirements. Taking the example of [Sales], variations can be [Sales Previous Year], [Sales YTD], [Sales Previous Year YTD], [Sales Forecast] etc. Further, KPIs often build on each other in so called KPI trees (visualized in the picture above).
Given a high number of KPIs which are also often interlinked due to their calculation logic, it is important to organize and manage them in a good way. In this article, I want to introduce a very effective and important method for doing that: The DRY-principle.
What is the DRY-Principle?
DRY stands for Don’t-Repeat-Yourself and is a pattern originating from the software development world. Explained in plain language, it means that each element of a (software) solution should only be defined once in order to reduce repetitions and redundancy.
This principle is important and effective because it means that when a certain definition or pattern has to be changed, it has to be done in only one place and all depending objects (should) change predictably.
Let’s apply this principle to the definition and management of KPIs or custom calculations in a BI & analytics solution. In the following, I will demonstrate this with Microsoft Power BI with which KPIs are defined via so called Measures.
Measures in Power BI are created applying DAX, which is a very powerful functional programming language to implement even the most complicated calculations if required. Measures are dynamic and calculated “at runtime” while the user interacts with a report, e.g. changes a filter or drills down a hierarchy.
Applying the DRY-Principle for Measures in Power BI
I will demonstrate the application of the DRY-principle using again the example for [Sales] in a hypothetical analytics solution for sales performance measurement. Please note, the DAX language is used here but it is not essential for you to understand it fully to follow the examples.
First, I will show a very common set of Measures which are all based on the same base KPI [Sales] but vary on the date dimension:
| Measure | Definition | Remarks |
|---|---|---|
| [Sales] | SUM( factSales[Value in CHF] ) | This is the base measure which simply takes the sum of the column containing the relevant values for sales volume |
| [Sales PY] | CALCULATE( [Sales], DATEADD(dimDate[Date], -12, MONTH)) | In order to make direct year-over-year comparisons, a previous year (PY) variation of [Sales] is created which simply references [Sales] and goes back 12 months on the date dimension |
| [Δ Sales CY vs PY] | [Sales] – [Sales PY] | The absolute difference between current and previous year sales |
| [Δ% Sales CY vs PY] | DIVIDE( [Sales] – [Sales PY], [Sales PY] ) | The percentage difference between current and previous year sales |
| [Sales YTD] | TOTALYTD( [Sales], dimDate[Date] ) | Year-to-date sales |
| [Sales PY YTD] | TOTALYTD( [Sales PY], dimDate[Date] ) | Year-to-date sales of the previous year |
| (…) | etc. |
As you can see, each measure builds on a previously defined measure. If for example the original table column containing the [Values in CHF] is changed in the data transformation process, this has to be changed in only one measure. All other measures are immediately changed as well in a predictable way.
Taking this further, there are often requirements for special variations of a certain base KPI based on a set of filters. Also here we also apply the DRY-principle with no problem:
| Measure | Definition | Remarks |
|---|---|---|
| [Sales DACH] | CALCULATE( [Sales], dimRegion[Region] = “DACH” ) | We reference again the base measure [Sales] but filter it within the measure for only the region “DACH” |
| [Sales PY DACH] | CALCULATE( [Sales PY], dimRegion[Region] = “DACH” ) | Same as above, but with reference to [Sales PY] |
| (…) | etc. |
Going even further, it is often required to reference multiple base measures to build a KPI:
| Measure | Definition | Remarks |
|---|---|---|
| [Material Costs] | SUM( factMatCosts[Value in CHF] ) | Base measure for the material costs |
| [Contribution Margin I] | [Sales] – [Material Costs] | The KPI contribution margin in this example is defined as the difference between sales and material costs |
| [% Contribution Margin I] | DIVIDE( [Contribution Margin I], [Sales] ) | Simple margin calculation which references other measures |
| (…) | etc. | |
| [Contribution Margin I PY] | [Sales PY] – [Material Costs PY] | Previous year variation which references two PY base measures |
| (…) | etc. |
Here again, if the definition of e.g. the Contribution Margin I changes, it has to be adjusted in only one place.
Conclusions
Applied rigorously, the DRY-principle allows changes to KPIs in a BI solution to be implemented fast and with high certainty for proper functionality (after the change). It is thus an important factor for long-term operations and further development of a BI tool.
The examples presented here are based on Microsoft Power BI but can certainly applied to any other BI tool (if it allows for cross-referencing in custom calculations).
DRY is simple and highly effective and it should be applied by anyone striving for a clean solution design and best practice.