
/// Managing and optimizing data quality is a process of continuous improvement and in many cases strongly driven by an organization's culture. Adequate quality of relevant data is crucial for data-driven decision making processes. A business intelligence (BI) solution can make quality issues transparent and help to monitor and track the improvement over time. A BI-tool should however not be used to fix problems for various reasons. This article gives an overview and advice on dealing with data quality.
Introduction
In every data & analytics project I was part of so far in my professional life, data quality was an issue. It is an evergreen in the data management space that will likely never go away. As long as humans interact with IT systems, there will be inaccuracies, inconsistencies, incompleteness and many more issues with data in such systems.
There are many ways and tools to identify, categorize and fix quality issues out there. With this short article, I want to share what in my experience works, in particular how to leverage the possibilities a BI & analytics tool gives us with dealing with that problem.
Please Don’t Try to Fix Data Quality Issues with Your BI-Tool
When implementing a BI-tool, data quality problems become apparent quickly. Whether it be incomplete fields, duplicate entries or lacking referential integrity, these issues are very visible once data is transformed and aggregated in reports and dashboards for analysis.
Modern BI & analytics tools like Power BI from Microsoft are incredibly flexible and powerful in dealing with low quality data. It often requires only a few clicks to “quick-fix” issues. Let’s just find-and-replace this wrong value. Or how about we use a manual input mapping table to replace an incomplete categorization of products?
Because so many “quick-fixes” are at hand, it is very tempting to actually implement them directly in the BI-tool. There are however several problems attached to such an approach:
Quality issues are only fixed at the moment of fixing them. Organizations change over time and so does their data When fixing problems in the BI-tool, they are still wrong at the source and other applications have to deal with them again With each fix being implemented within the BI-tool (and with that I also mean as part of the data cleansing and transformation process), the solution becomes more burdened with an increasing number of additional necessary steps, exceptions and special rules in the data process. This increases the complexity of the solution and the data process and hence decreases operational reliability going forward Given that, it is obvious that one should always strive to improve the data quality directly at the source and not as part of the data value chain from data source to visualization.
The BI solution however can be the perfect tool to visualize and monitor the status and improvements of data quality. More on that further below.
Always strive to fix data quality problems as close to the (data) source as possible.
Types of Data Quality Issues
Please note, categorizing data quality issues into types is not very important by itself. But it can help to better identify problems and structure the strategy to fix them.
There are different ways to categorize data quality issues. The following is my view and certainly not the only truth (or even complete).
| Data Quality Type | Description / Example |
|---|---|
| Duplicate data | Usually this is the case for duplicate entries in master data tables. For example, a customer is recorded twice with a slightly different name |
| Incomplete data | Some fields are always or mostly empty. Or, when some data is just simply not collected at all. For example, customers which are not categorized into an industry bucket (which would be important for analytics) |
| Inconsistent data (across systems) | Usually a dominant problem in organizations with many systems in place. For example, when products are simultaneously recorded in a sales system as well as an ERP-system used for production |
| Lack of referential integrity and erroneous relationship cardinality | When transactional data is recorded (e.g. a sales transaction), this transactional data should have a defined relationship with dimensional data (master data). For example, a sales transaction usually refers to one or many products and one customer via unique keys |
| Lack of standardization of master data | For example, the naming of countries is not standardized across systems (e.g. “United States”, “United States of America”, “USA”, “US” etc.) |
| Inaccurate and erroneous data | E.g. simple misspellings on data entry |
| Lack of currency | When data becomes outdated over time (e.g. change of customer address) |
| Lack of data validation | When there is no validation if a data entry conforms to the required format. A classical example is the e-mail address format |
| and more … |
Ways to Improve Data Quality Over Time
If someone would ask me: “How would you fix our data quality issues?”, this would be my answer:
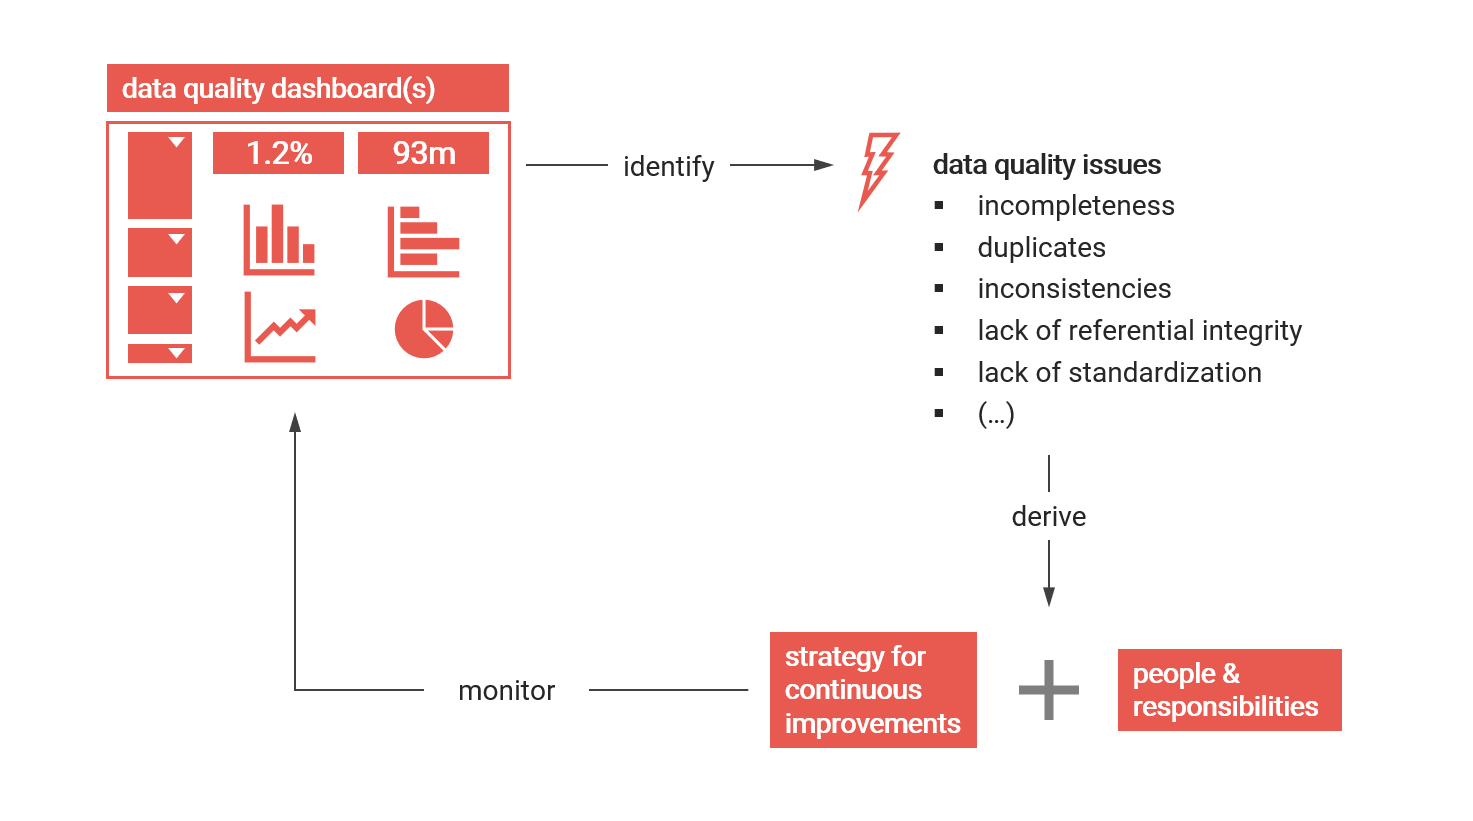
- Make data quality issues transparent and clearly identify which ones are important and need to be improved and monitored going forward. This means there are some issues, which are probably less important and can be fixed later or even be ignored. Don’t try to fix everything at the same time
- Make sure you understand the causes of the identified issues and based on that define and operationalize a strategy to improve the identified issues going forward. Clearly define responsibilities in your organization to “own” certain data domains and their quality metrics (e.g. “HR data”). Please note, strategies to fix issues are usually specific to the data domain and systems involved
- Consider thinking about data quality as a cultural topic in your organization. In the end, it is important that all people interacting with data in the systems are aware and know the importance of good quality data. Educate and sensitize your people accordingly
- Consider using a data cataloging system in order to have a dictionary of the data available in your organization, describing its content, quality, lineage and more
- Continuously monitor data quality, ideally with a BI-tool. Define and visualize metrics to track the improvement of quality over time
Further, there are dedicated software tools available on the market to deal with data quality problems and the use of AI (machine learning) in that scope is on the rise. Maybe such dedicated tools are helpful in some way. However, I believe once the issues are transparent, a strategy with clear responsibilities is implemented and people are aware of how important good quality data is, a continuous improvement will be visible soon even without an additional software.
Monitoring Data Quality with a BI-Tool
The primary purpose of a BI & analytics solution is to extract, prepare and visualize data relevant for decision making processes. Once source systems are connected, data models are built and KPIs are visualized, data quality issues become apparent quickly. At this point, the BI solution is actually the perfect tool at hand to visualize, monitor and track data quality.
Here are some examples of how to visualize data quality issues with a BI-tool:
- Listing all products appearing in transactional data for which there is no matching master data (i.e. lack of referential integrity)
- Measuring the incompleteness of a field (i.e. the percentage of nulls of a field)
- Listing and measuring duplicate master data entries (different ways to do that)
- Listing of unique attributes of a master data table and detection of depreciated or redundant entries. For example, the segmentation of customers into industries based on which sales performance is measured over time – some segments are maybe not relevant anymore or some are redundant with slightly different labels across systems
As mentioned, always focus on the relevant quality issues and visualize those (not all quality issues are relevant to data-driven processes). And make sure the people being responsible for data and its quality have access to this monitoring dashboard(s).
Conclusions
As long as there is data there will be quality issues with it. We saw there are different types of such issues, which can help to better structure the detection and improvement of problems. Improving quality of data is a continuous improvement process. Even more, it is a cultural topic within the organization. It is crucial to educate and sensitize people of its importance.
Talking about hands-on advice, I can recommend to use your BI-tool to visualize and with that make data quality issues transparent. Don’t try to fix these issues within the tool though, it will result in bad solution design and low operational reliability in the long term.
If issues are transparent and being monitored, the success of quality improvement strategies can be measured. Strategies to improve data quality are specific to the data domain and systems. Make sure there are clear responsibilities for data in your organization. Given that, improvements in data quality should be visible soon.