
/// Choosing the right BI & Analytics software tool is an important decision for any organization embarking on the journey to become (more) data-driven. This article summarizes the 5 most important criteria to consider in the tool selection process.
Introduction
There are 20 different software tools in the Gartner Magic Quadrant for Business Intelligence Platforms (as of March 2022). Choosing the right tool for your organization can quickly become overwhelming especially when most of them seem to promise “everything you need” in their individual marketing materials.
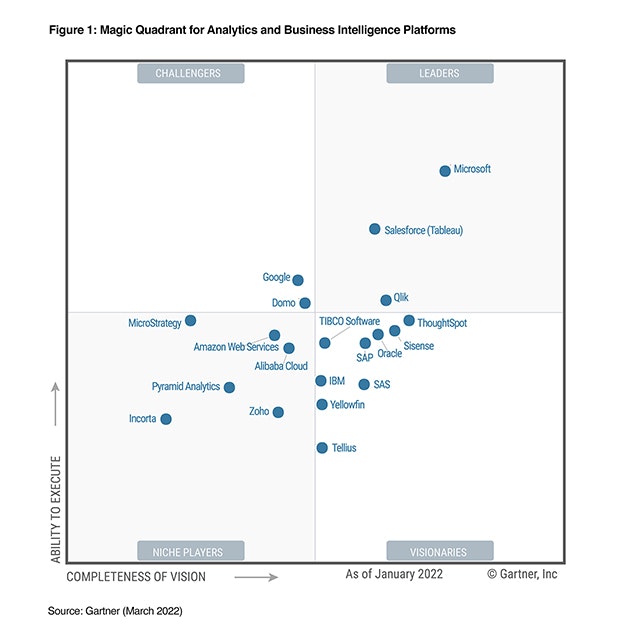
I have seen and used various different market leading tools in different corporate setups. Based on that experience I believe the following should be the leading criteria in selecting the right BI & analytics tool.
Comprehensive coverage of the data & analytics value chain
The following are the generalized steps in the data & analytics value chain:
- Data connection and extraction (from data source)
- Data transformation (cleansing, preparation etc.)
- Data modeling (facts and dimensions)
- Data presentation (visualization)
- Publishing and sharing of analytics content (e.g. dashboard) with other people within the organization
- The more comprehensive a BI & analytics tool can cover these steps, the better.
If for example the data extraction and transformation is not covered, you will need to acquire, license and implement yet another tool to do just that. Further, if several tools are needed to cover the value chain, data needs to be transported from one tool to another which requires additional time, computing power and makes the entire solution less robust because of the additional interfaces.
Please note, if your data architecture uses a data warehouse (DWH), data lake or data lakehouse the need for coverage of the analytics value chain is of course different when for example all data transformation is done before data is loaded to the DWH and the BI tool is solely used for data presentation.
Low-code and intuitive to use
Low-code means that the necessity to use programming / coding in the tool is limited because most functionality is available via buttons, dropdowns and drag-and-drop in the tool interface. This is a very important requirement if you want to enable your business users to directly work with the tool and become more data literate.
Note: The more code that is required to work with a tool, the harder adoption by business users will become in your organization. Because by nature, business users are not programmers. However, many are used to work with Excel formulas and hence have at least some basic idea of working with logical function statements.
Closely related to this criteria is the functionality to use programming driven by more complex analytics requirements. Many tools for example allow the direct use of Python or R code to build more advanced analytics content and even machine learning applications.
Large user community
A large, worldwide user community for a software means it is easy to find help and resources online (e.g. via Google search) if one runs into a specific problem (or wants to self-teach the tool). It also means the tool should not be too bad to work with, otherwise there would not be a large user community.
The user community is not to underestimate because the easier one finds solutions online the more efficient it becomes to build analytics with the tool (and the less frustrating it is). Further, your organization will be less dependent on external experts because internal business users can solve problems themselves.
Also note, it is easier to find and recruit people which have the skills in working with a broadly known and applied software (or programming language, like for example SQL).
How can I estimate the popularity and size of a user community?
You could use the Google Trend Analysis tool to estimate the relative popularity of a given set of tools.
To illustrate this, I ran the tool for the three market leading tools Power BI, Tableau and Qlik Sense for a time range from 1 January 2016 to roughly end of September 2022. There seems to be a strong upward trend for Power BI worldwide while Tableau and Qlik stagnate over time.
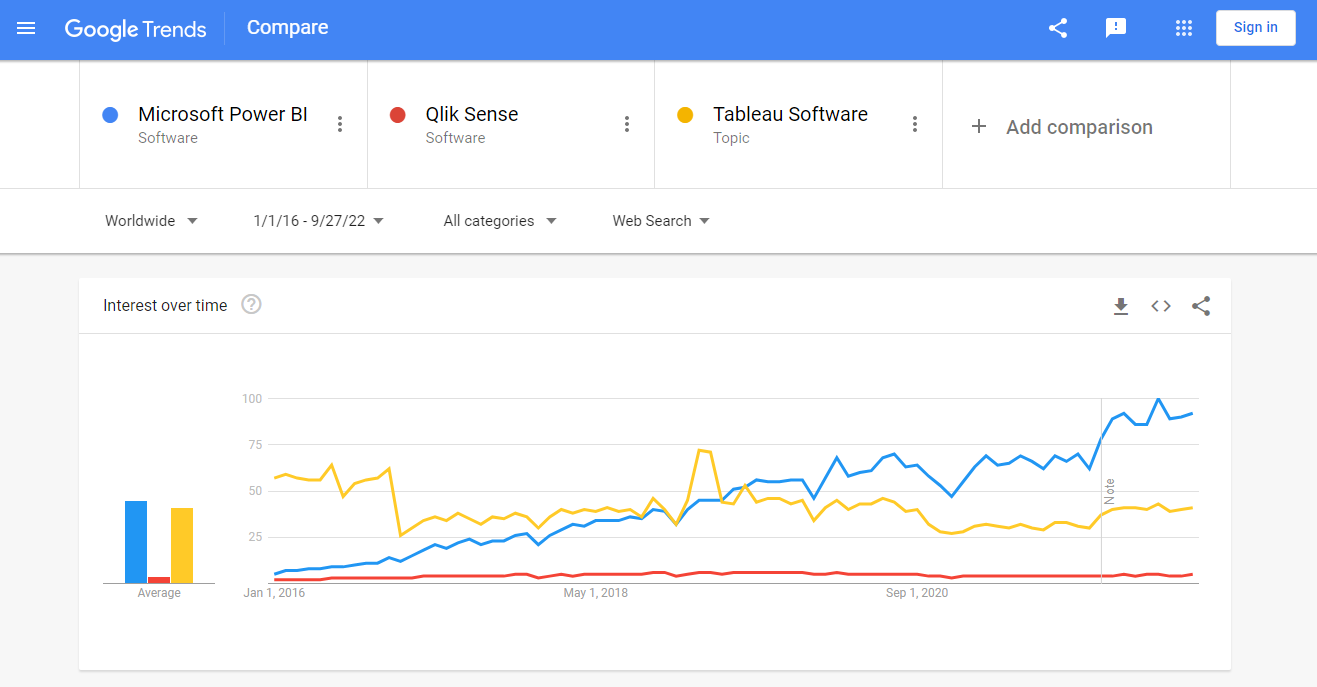
Please note: It is a bit tricky to find the right search term as Google categorizes them into groups like “Software” or “Topic”. It probably makes sense to play around a bit and get an understanding of the popularity evolution of each tool.
Easy integration and many data connectors
When you acquire and implement a new software, you want to make sure that it integrates well with your existing IT infrastructure. Most importantly, it should be no problem to connect with your relevant source systems or file repositories (e.g. Sharepoint) and extract data with good performance. Therefore, make sure the selected tool has many data connectors built into it.
Further, be very careful if a “custom connector” is needed in addition to the BI tool to connect with a source system. Such custom connectors are often built by very small teams / companies (or even just a single person) and you don’t want to make your entire BI landscape dependent on those.
Low infrastructure requirements and license costs
The new tool should be easy to implement and maintain, and should not cause an extensive IT overhead. Further, it should be easy to scale in your organization. Modern BI & analytics tools therefore often run in the cloud and can as such be easily maintained and accessed by many users.
Finally, obviously keep license costs in mind in your selection process (but don’t give too much weight to this criteria as the return in value of the new tool will quickly “pay back” such costs).
Conclusions
When successfully implemented and applied, a BI & analytics tool can bring tremendous value to your organization. It will enable your people to automate tasks and processes and to focus on actual data analysis. Your people will become more data literate, decisions will be more data-driven and your organization as a whole will become more competitive as a result.