5.3 | Working with and applying filters
After creating our first visualization, let's continue with different ways of filtering this chart on the report page.
As described in chapter VERWEIS, there are different ways of establishing a filter context that influences a visualization:
- Slicer: A slicer is directly placed on a report page for the purpose of allowing the report users to filter the visualizations themselves by the different dimensions of the data model
- Filter pane: There is also a filter pane available in the report builder where we can place filters that either impact a specific visualization, a report page entirely or all report pages in the Power BI file. This method of filtering is best suited for pre-filtering data and visualizations, which should not be changed by end-users
- Measures (DAX): We can also set and manipulate the filter context inside a measure with the functional language DAX. We will look at this method in the next chapters
Let's explore the first two options in this chapter. The third options with measures is discussed in chapter VERWEIS.
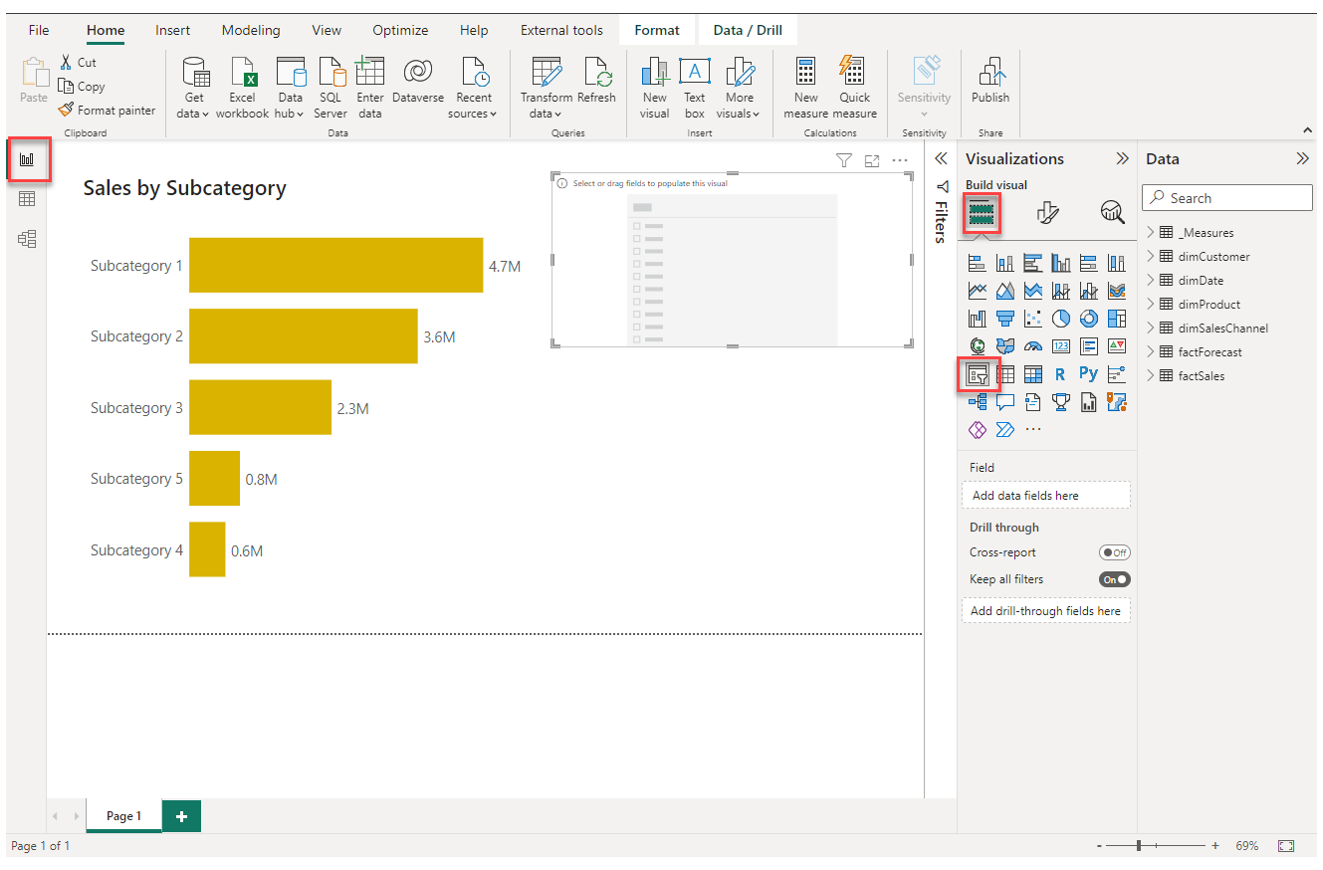
1. Place an empty slicer on the report page next to the bar chart visualization
Placing a new slicer element on the report page is similar to placing a new visual:
2. Place the field Date from dimDate into the slicer
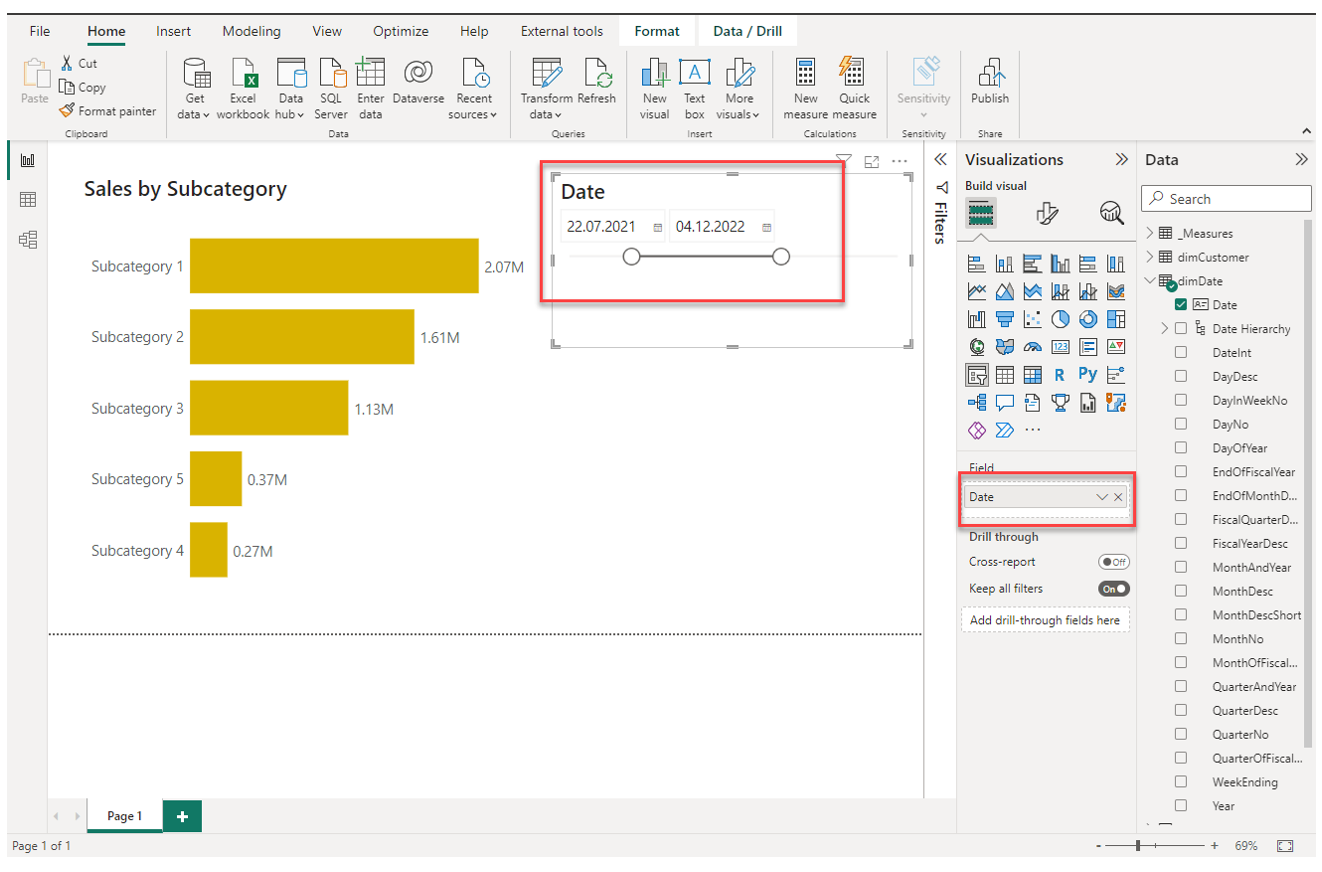
Feel free to play around with the slicer and observe how the visual is filtered respectively.
3. Place another empty slicer on the page and populate it with the field Channel Group from dimSalesChannel
4. Place the field Channel Desc from dimSalesChannel in the same slicer right under Channel Group
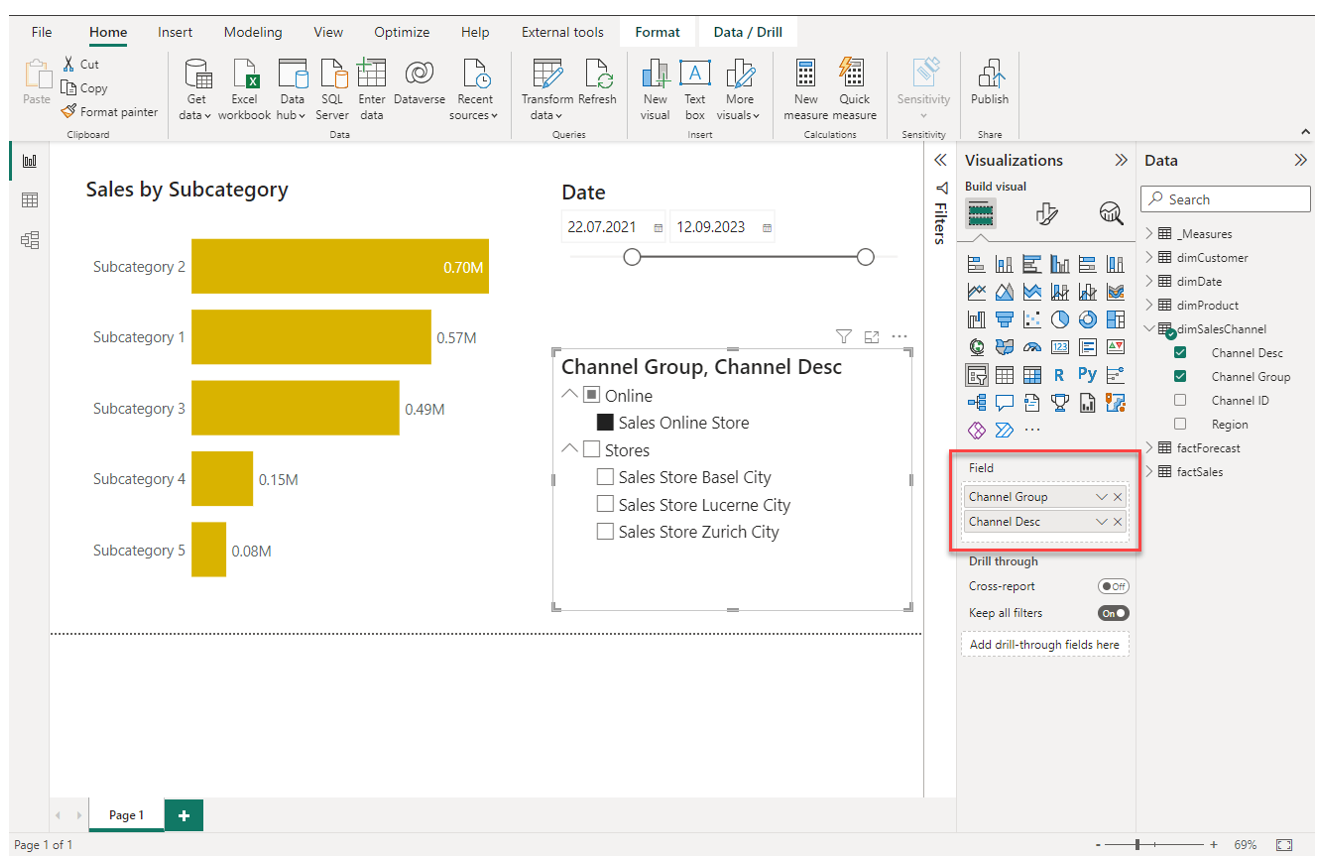
As you can see, we have now a second slicer with a small hierarchy. Note how both slicers, based on date and the sales channel, simultaneously influence the chart visual.
5. On the filter pane, place ProductType from dimProduct under Filters on this page and only select "Manufactured Product"
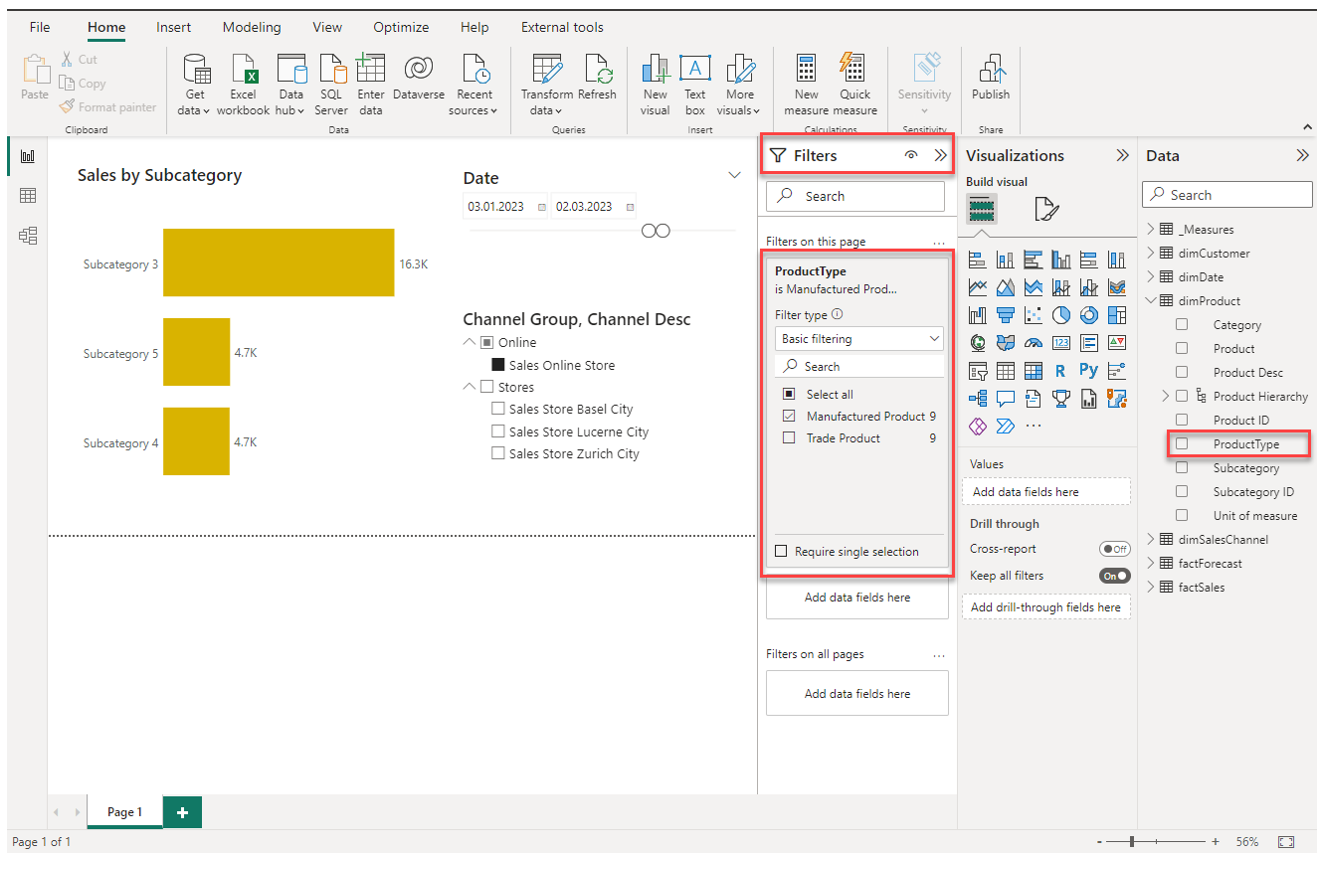
We have now established a filter context that simultaneously filters by date, by the sales channel dimension and by the product type.
Multiple filters used simultaneously are always logically connected with an "and". In this example, the date is between A and B and Channel Group is equal to [...] and Channel Desc is equal to [...] and [...] etc.
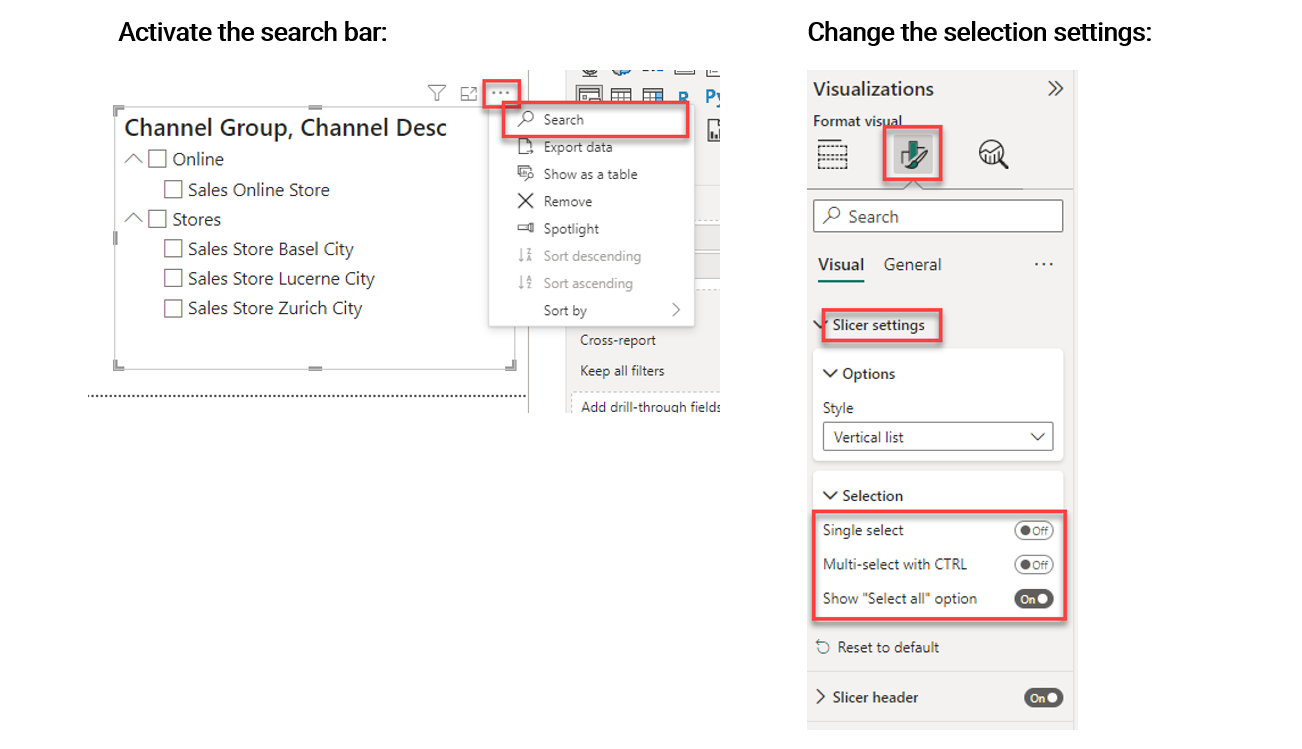
6. Configure the slicer settings
For the slicer that filters Channel Group and Channel Desc, let's change some settings.
- Activate the search bar via the three small dots appearing when hovering over the slicer
- In the formatting options, deactivate Multi-select with CTRL (so a user can multi-select without holding the CTRL-key) and activate Show "Select all" option
I would recommend to use both options as they improve the user experience of the dashboard.
7. Add a second visualization and configure the interactions between the slicers and the visuals
[...]
In this chapter, we explored how to use slicers and the filter pane to establish and dynamically change a filter context on a report page. As introduced in the beginning of this chapter, we can also manipulate the filter context with measures. This is the topic of the next few chapters.