5.4 | Creating and configuring the first measures
In this chapter, we will create the first measures using DAX. First, I will explain how the code for a measure is structured. Following that, we will create four basic measures which I use in almost every BI solution in practice.
Remember, measures are dynamic custom calculations which means they are immediately re-calculated as soon as for example the filter context on a given report changes. This is opposed to static custom calculated columns created in Power Query, which are only updated when the dataset is refreshed.
5.4.1 | How a measure is defined with DAX
The following illustration shows how a measure is structurally written with DAX. The first example is a very simple measure, though quite important in many real-world use-cases. The second example shows how we can use variables and also reference other measures inside a new measure.
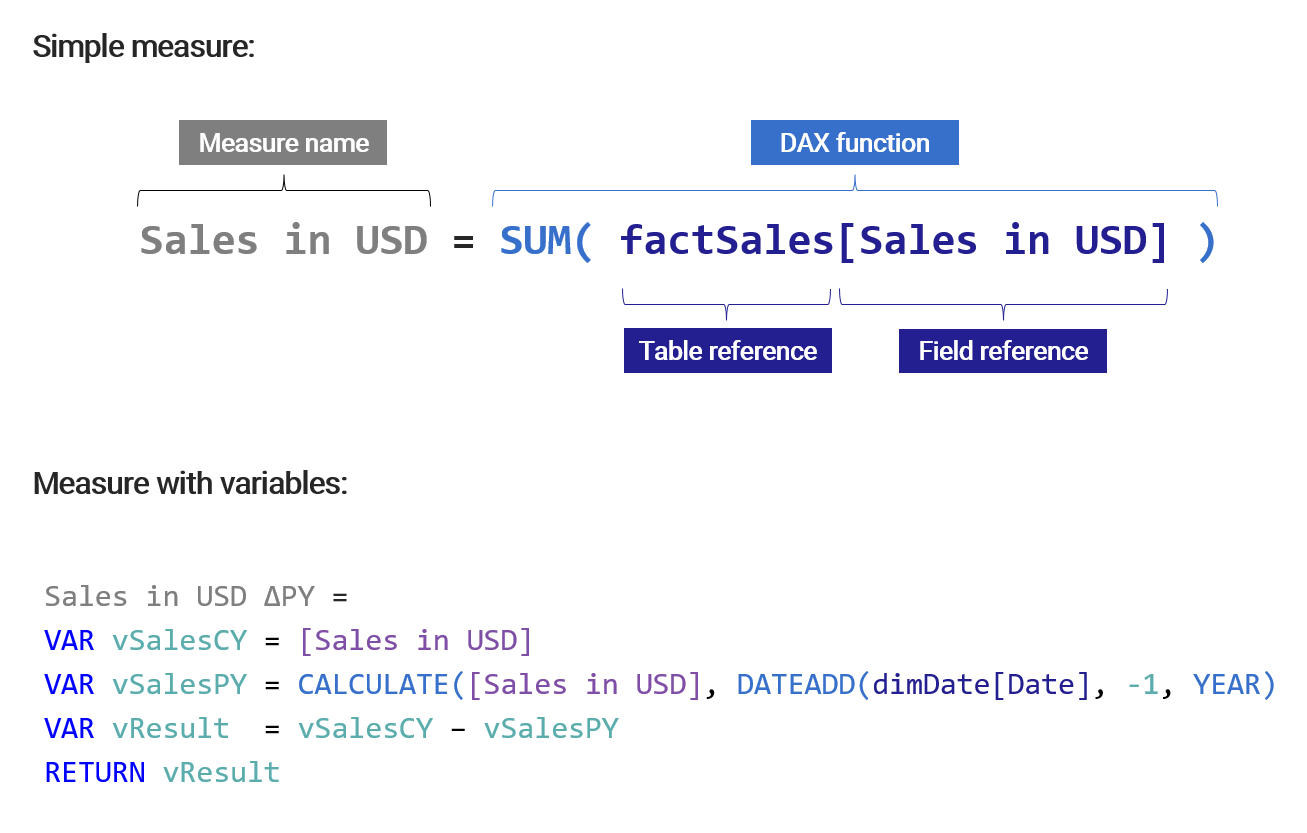
Note how in the second example, first a variable (vSalesCY) is created that simply references another measure without further manipulation. The second variable (vSalesPY) also references the same measure, however its filter context is manipulated with CALCULATE() (see chapter VERWEIS). Finally, the variable vResult is defined as the variation between the first two variables and it is returned as the result for the measure (after RETURN).
Don't worry if that seems a little overwhelming at this point. We will now create the measures step-by-step and it should become more clear accordingly.
5.4.2 | Basic measure for sales in USD
To create a new measure, do a right-click on the table _Measures and select New measure. Note, each Measure has a home table where it is stored. Like described in chapter VERWEIS, it is good practice to have a separate table in the Power BI data model specifically for storing and organizing measures.
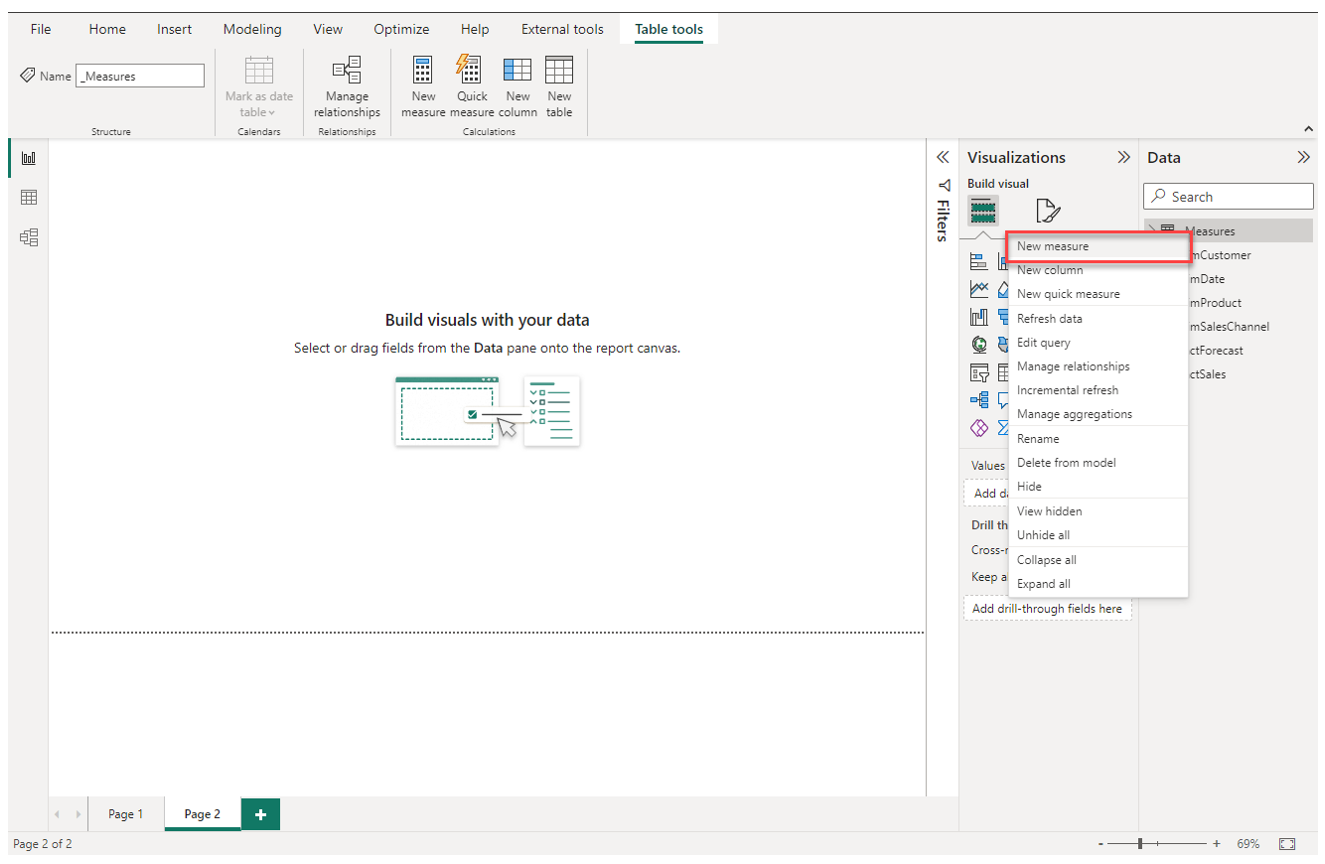
When creating a new measure, the formula bar appears and we can enter the measure name followed by the DAX code.
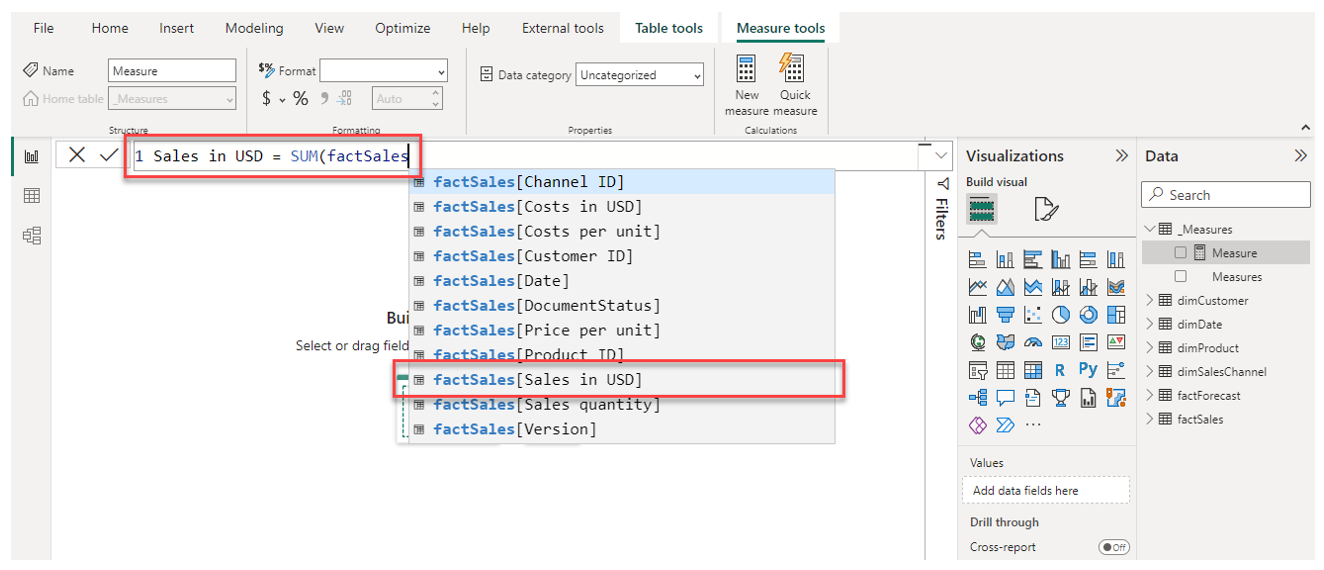
The measure we want to create is defined as following:
Sales in USD = SUM( factSales[Sales in USD] )
When you start typing after the equal sign, you will notice how Power BI gives you recommendations for functions, tables and fields to be used. This is called IntelliSense.
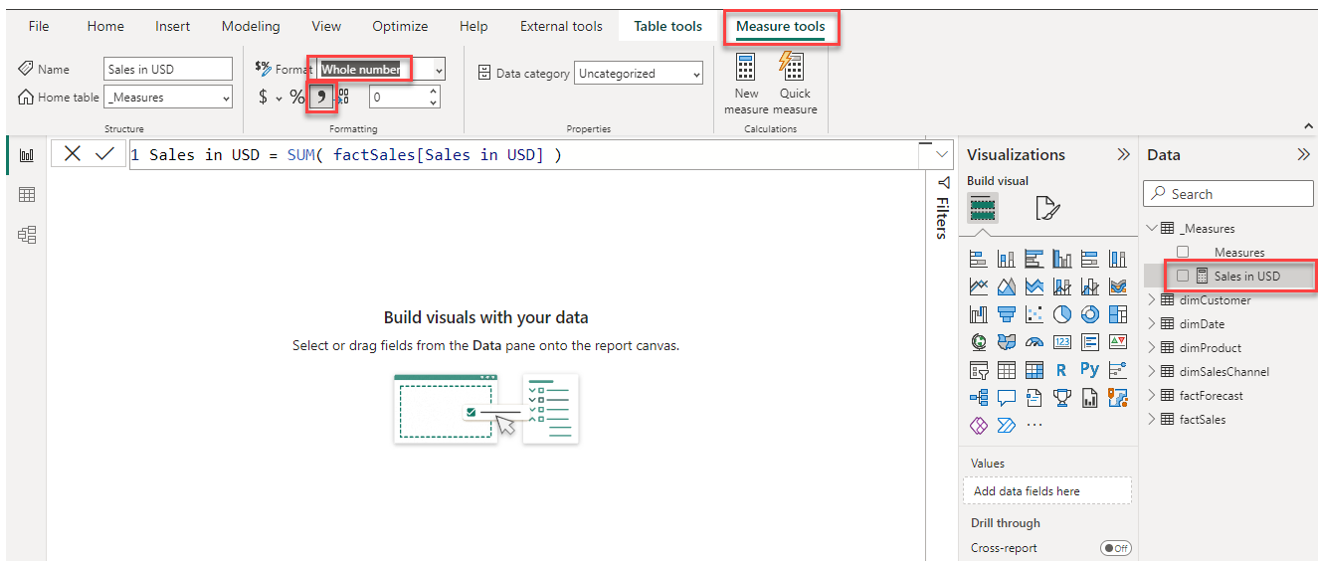
When finishing typing the formula, confirm via the checkmark symbol. The new measure should appear under the _Measure table:
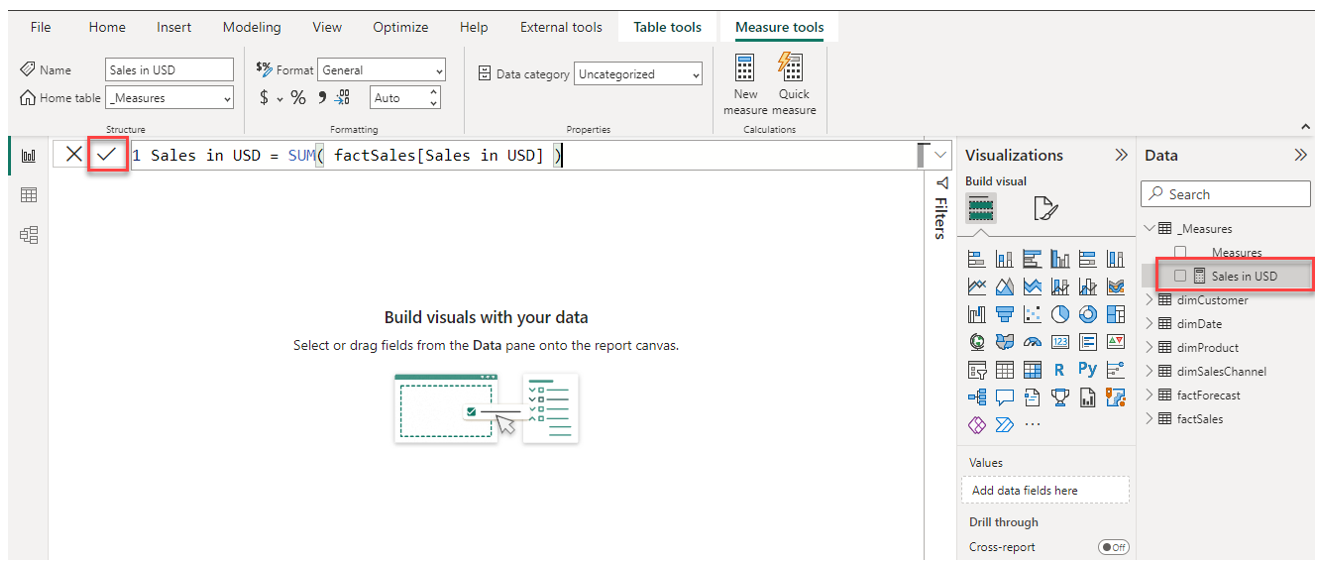
Before we use the measure for visualizations, let's make sure the number format is correct. When having selected the measure in the table navigation, you can change the formatting options in the main navigation pane. Let's format the new measure as a "Whole Number" with thousand's separators activated:
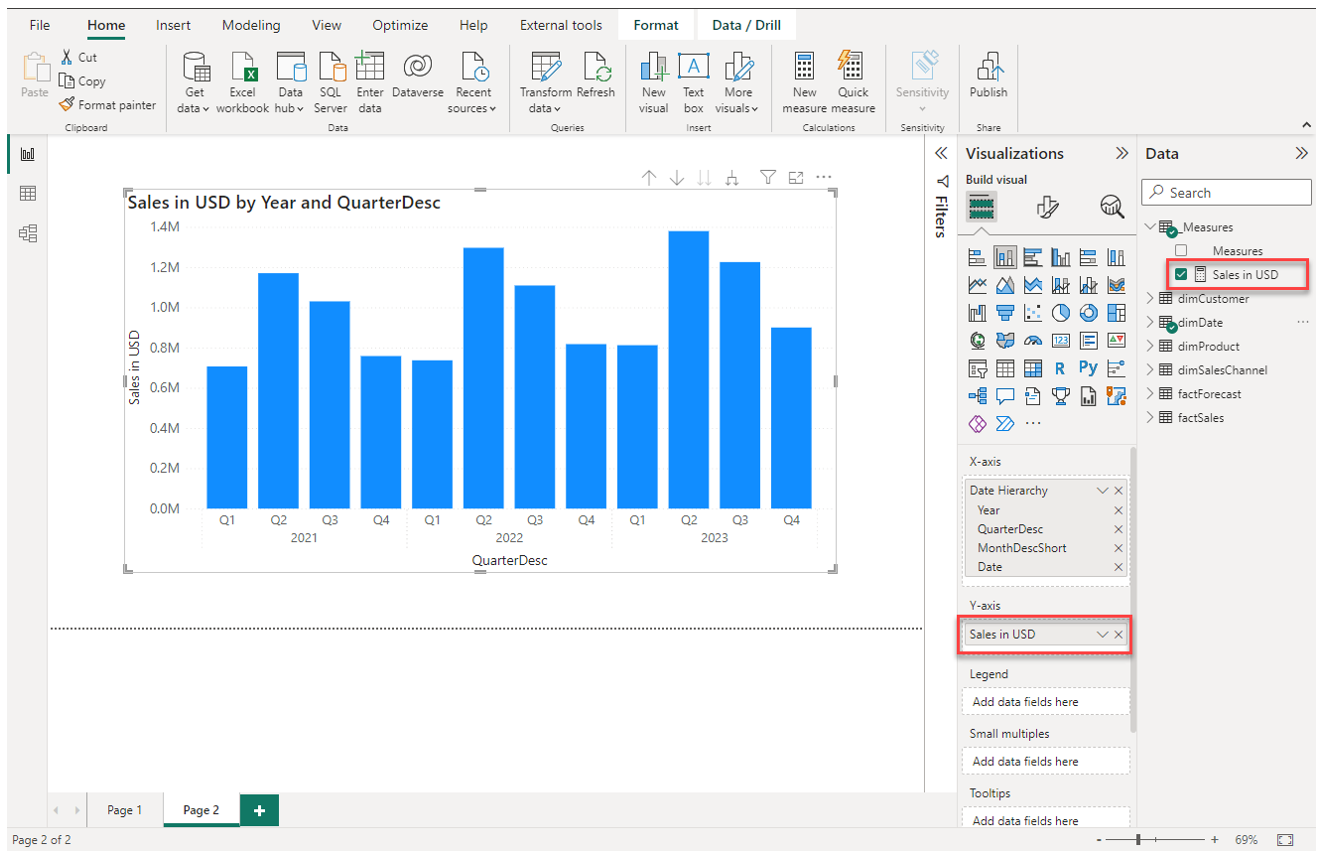
Now we can use the measure in a visualization, just like we did it in the previous chapter:
5.4.3 | Measure for previous year sales in USD
The next measure follows a very commonly used pattern for time / date calculations. What we want to achieve is to manipulate the filter context inside the measure so we always get the previous year value for sales from the perspective of a currently selected year.
Let's create another measure as following:
Sales in USD PY =
CALCULATE ( [Sales in USD], DATEADD ( dimDate[Date], -1, YEAR ) )
Note how we reference the previously created measure [Sales in USD] inside the new measure.
Then, create a new report page and place an empty matrix visual on the canvas. Populate the matrix with the measures [Sales in USD] and [Sales in USD PY] and with Year from dimDate as the rows.
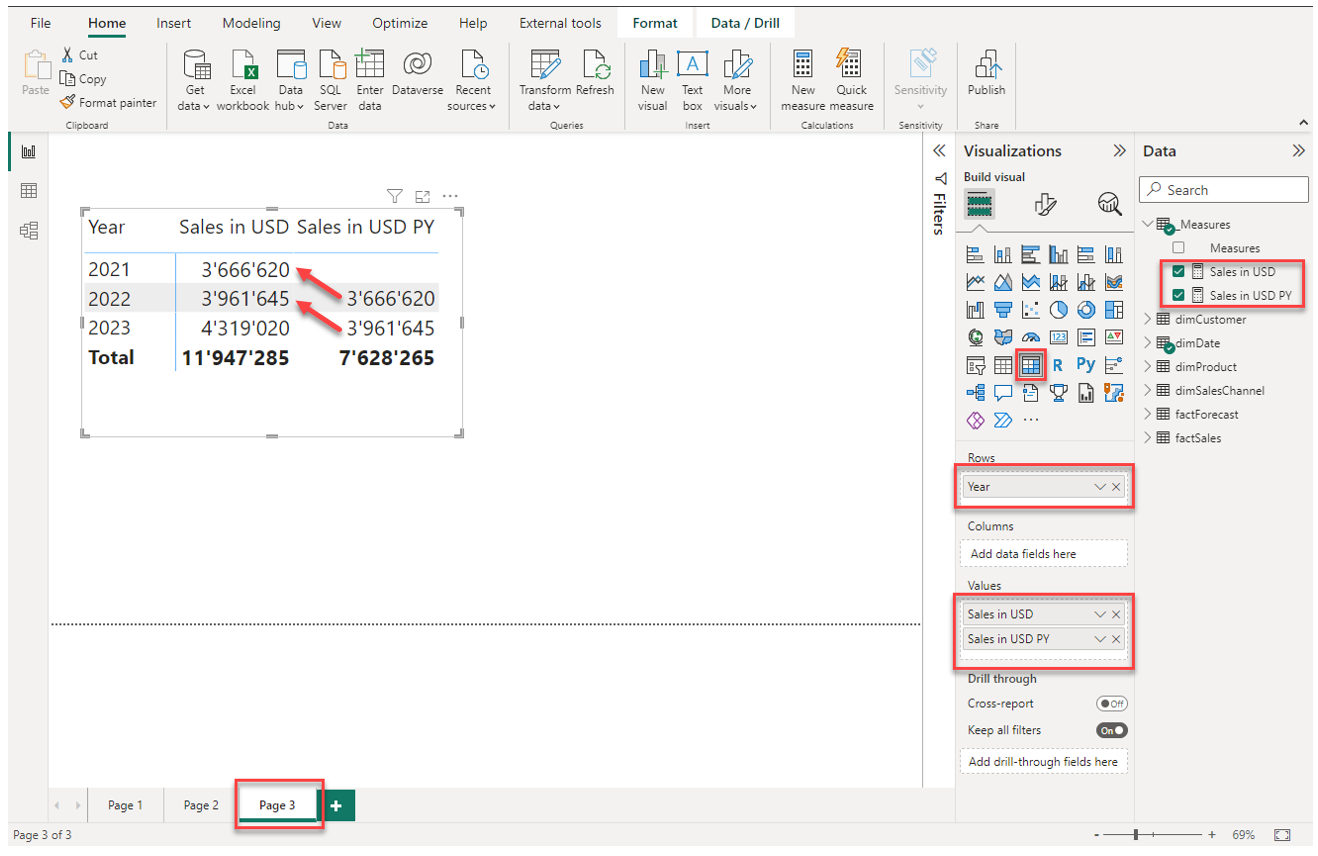
Now let's take a moment to understand what is going on. The filter context, given by the rows in the matrix visual is Year from dimDate. The measure [Sales in USD] shows the sales amount for each year. The measure [Sales in USD PY] on the other hand always shows exactly the value of the previous year. The filter context is basically manipulated to move the timeline back by one year, hence the "-1" and "YEAR" parameters in the DATEADD() function inside the measure. Working with dates and times in measures uses the framework of Time Intelligence in Power BI. This is the reason why we had to mark the table dimDate as a date table previously.
We will discuss the function CALCULATE() in more detail later given its relevance in practice.
The DAX function CALCULATE() is maybe the most important function used to create measures. It allows to specifically manipulate the filter context for a calculation. There are a lot of articles, guides and videos available on the Internet focused on this very function.
5.4.4 | Measure for year-over-year variance in sales in USD
Now that we have sales for the current and previous year defined in two measures, we easily create another measure that calculates the difference between the two using a simple substraction:
Sales in USD ΔPY =
[Sales in USD] - [Sales in USD PY]
Let's consider that in many real-world use-cases, the year-over-year variance is also needed in percentage:
Sales in USD Δ%PY =
DIVIDE( [Sales in USD] - [Sales in USD PY], [Sales in USD PY])
We use the DIVIDE() function instead of just "/" because the former handles division by zero better.
Make sure the formatting of both new measures is set appropriately and then place them in the matrix visualization we added previously:
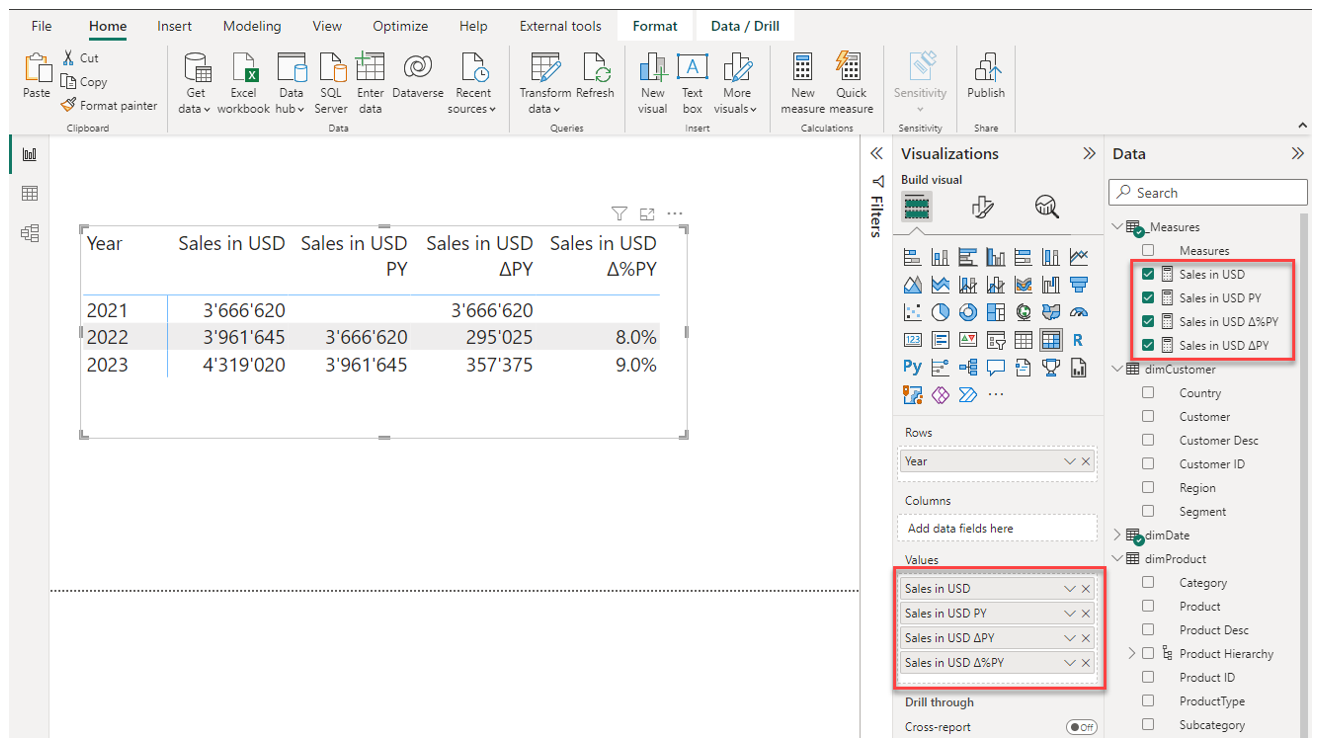
In this way, we can create very powerful reporting tables with drill hiearchies that are fully dynamic. Imagine the manual effort required to perform this calculation for example in an Excel spreadsheet.
5.4.5 | Chapter conclusion
We now created our first four measures with using quite simple DAX code. These four measures though are very powerful and they represent the base set of measures for most Power BI solutions in my own practice.
In the next chapter, we will work with the all important DAX function CALCULATE() to manipulate the filter context inside a measure.