5.8 | Creating a calculated table with DAX
For a measure to work properly, the DAX code used must return a single value. But there are also DAX functions that return entire tables. Given that, we can create calculated tables using DAX that are part of the data model. In this short chapter, I want to show how this is done using different DAX table functions.
A calculated table is stored in the data model and only recalculated when any of the tables it uses data from is refreshed or updated. I like to think of it as tables that are created between Power Query and the report designer.
5.8.1 | Creating a new calculated table
To create a new calculated table, navigate to the Data view and click on New table under the Table tools navigation. In the appearing formula editor, paste the following DAX code and confirm with the checkmark symbol.
CalcTable1 =
VAR vtbl1 =
    CALCULATETABLE (
        SUMMARIZE ( factSales, dimProduct[Category], dimDate[Year] ),
        dimDate[Year] = 2023 || dimDate[Year] = 2022
    )
VAR vtbl2 =
    ADDCOLUMNS (
        vtbl1,
        "Total Sales", CALCULATE ( SUM ( factSales[Sales in USD] ) ),
        "Total Sales PY", CALCULATE ( SUM ( factSales[Sales in USD] ), DATEADD ( dimDate[Date], -12, MONTH ) )
    )
RETURN
    vtbl2
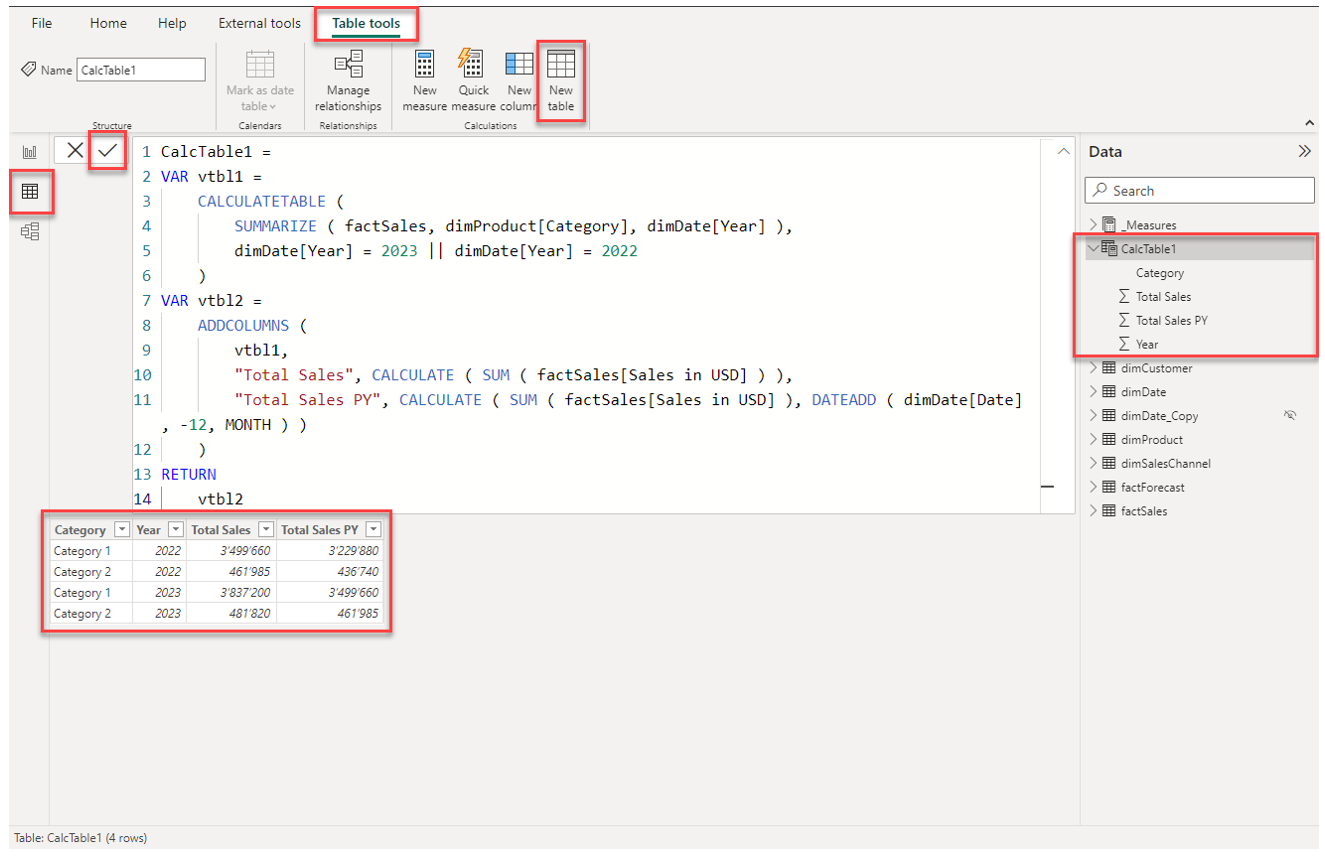
Notice how a new table has appeared in the data navigation. As for the other tables coming from Power Query, we can format fields, create hierarchies, connect them with other tables etc. In the screenshot, you can see that I formated the value fields as whole numbers with thousands separators.
Now let's understand what we are doing with the DAX code:
- First, we create a variable vtbl1 that stores an intermediate table that is based on factSales and basically groups by Category of dimProduct and Year of dimDate (similar to a GROUPY BY statement in SQL). This intermediate table is also filtered using CALCULATETABLE() by Year from dimDate
- Second, we use the intermediate table vtbl1 as the basis for another table stored as a variable vtbl2 and we add additional columns that calculate the total sales for the current year and previous year. Note how we have to use CALCULATE(), because otherwise the calculation is not performed on row level
- Finally, we return the table vtbl2 as the result of the code
5.8.2 | Addding a calculated column to an existing table
One this we can also do is to add calculated columns to existing tables in the data model. Note, this applies also to tables that are loaded from Power Query.
To add a new calculated column, click on New column under Table tools and add the following DAX code:
Total Sales ΔPY =
CalcTable1[Total Sales] - CalcTable1[Total Sales PY]
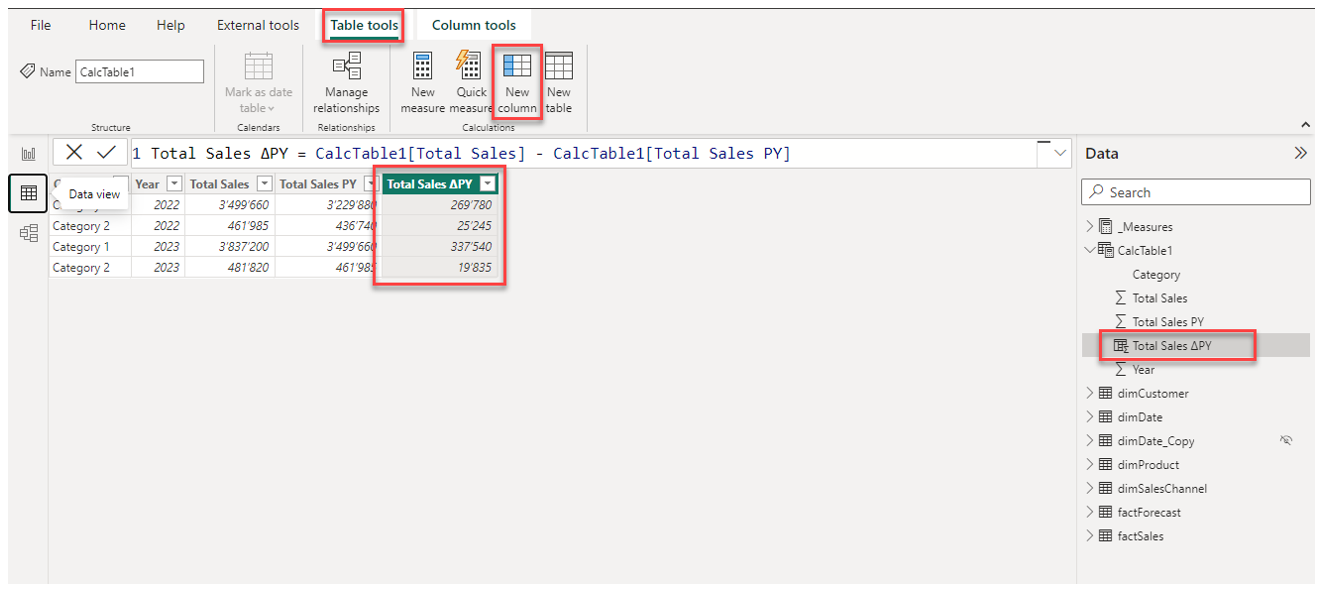
With this new calculated column, we simple calculate the difference between two already existing columns of the table.
5.8.3 | Using the calculated table and columns in the report
Of course, we use the newly created table and its columns in the report designer in the same way as any other table loaded from Power Query.
To confirm that the values in the new table are correct, let's compare them with the measures that we created earlier for total sales:
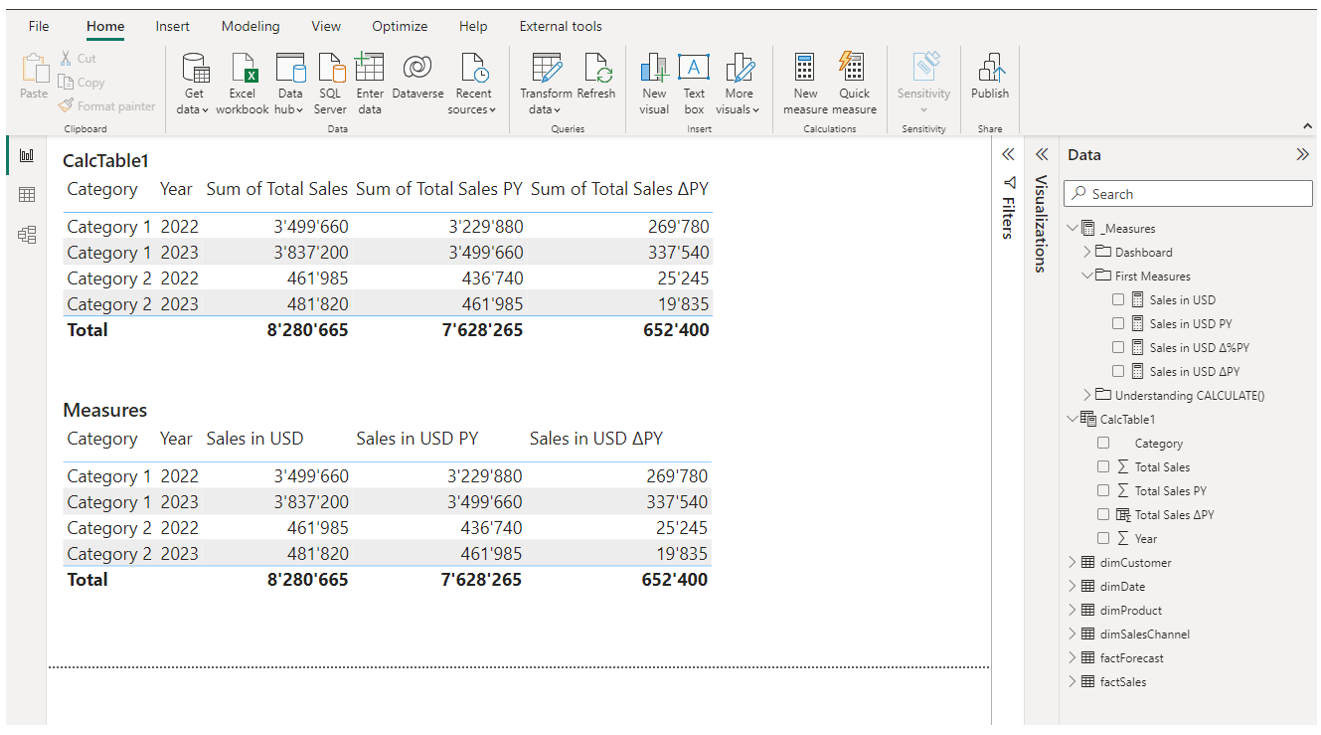
With this we can confirm that the values are identical.
5.8.4 | When to use calculated tables
Finally, a few words about use-cases when the use of calculated tables makes sense. In general, you should always try to implement a KPI with a measure, because it is the most dynamic and versatile way of working with custom calculations. Sometimes though, the requirements for a calculation are very complex and require the preparation of intermediate results. In such cases, it may makes sense to work with calculated tables.
Note, we can also use DAX table functions inside a measure to create intermediate tables based on which we then perform a specific calculation. The challenge with that is, that the intermediate table is not visible and the DAX formula becomes abstract and hard to interpret. Given that, another good use-case for calculated tables is to use this feature to understand and see intermediate tables with a temporary table. When the measure is then finally working as intended, the temporary calculated table can be deleted again.