6.4 | Working with reports to explore and analyze data
In this chapter I want to show some of the useful functionalities available when working with an existing Power BI report published to the Power BI Service to analyze and explore data.
6.4.1 | Resetting a report
The one function I always show first to my customers is the possibility to reset a report to its default state via a simple click of the reset button in the report header:
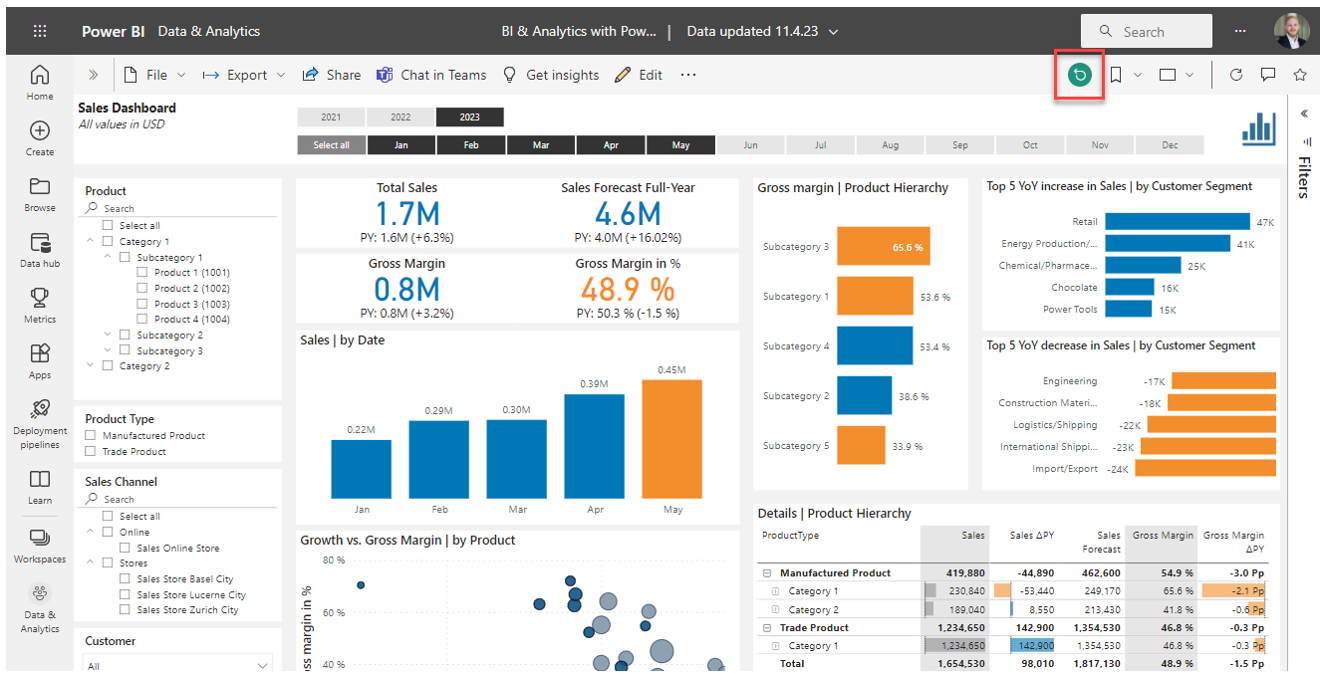
Please note, the default state is either (1) the state in which the report has been uploaded to the service or (2) the state in which a report has been saved last from the online editor.
If the reset button is greyed out, there are two possible reasons for that:
- The report is already in its default state
- The report creator has blocked this functionality via the report settings (see Persistent filters in the report settings)
6.4.2 | Drilldown and drillup in visuals
Whenever a visual has multiple dimension fields placed on an axis in a visual or rows in a table (columns is also possible, but less frequently used), we have the possiblity to drill along this hierarchy when working with the report.
When hovering over a visual, a small bar with different symbols will appear in the top right corner of that visual. The arrows pointing up and down are for drilling. They work as following:
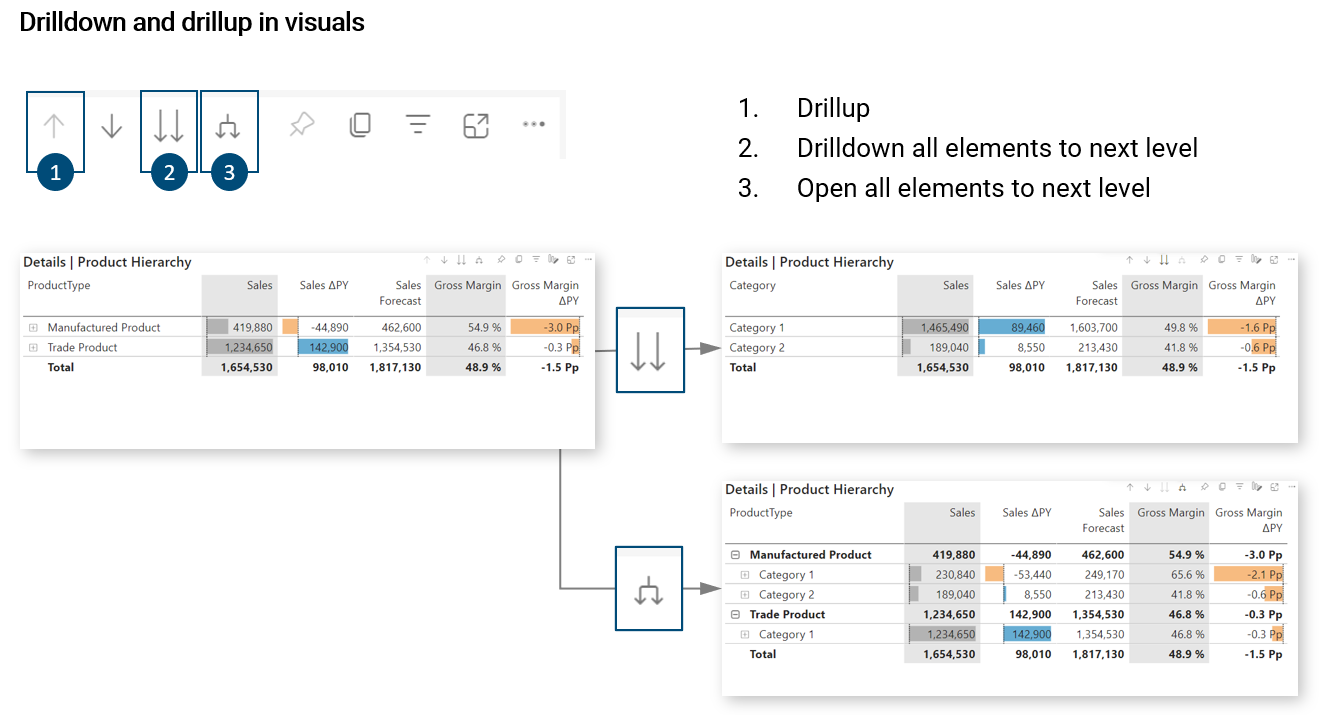
Please note, if one or many arrows are greyed out, it means you have either reached the highest (or lowest) level in the drill structure or there is simply no drill hierarchy in the visual.
6.4.3 | Working with slicers and understanding filter context
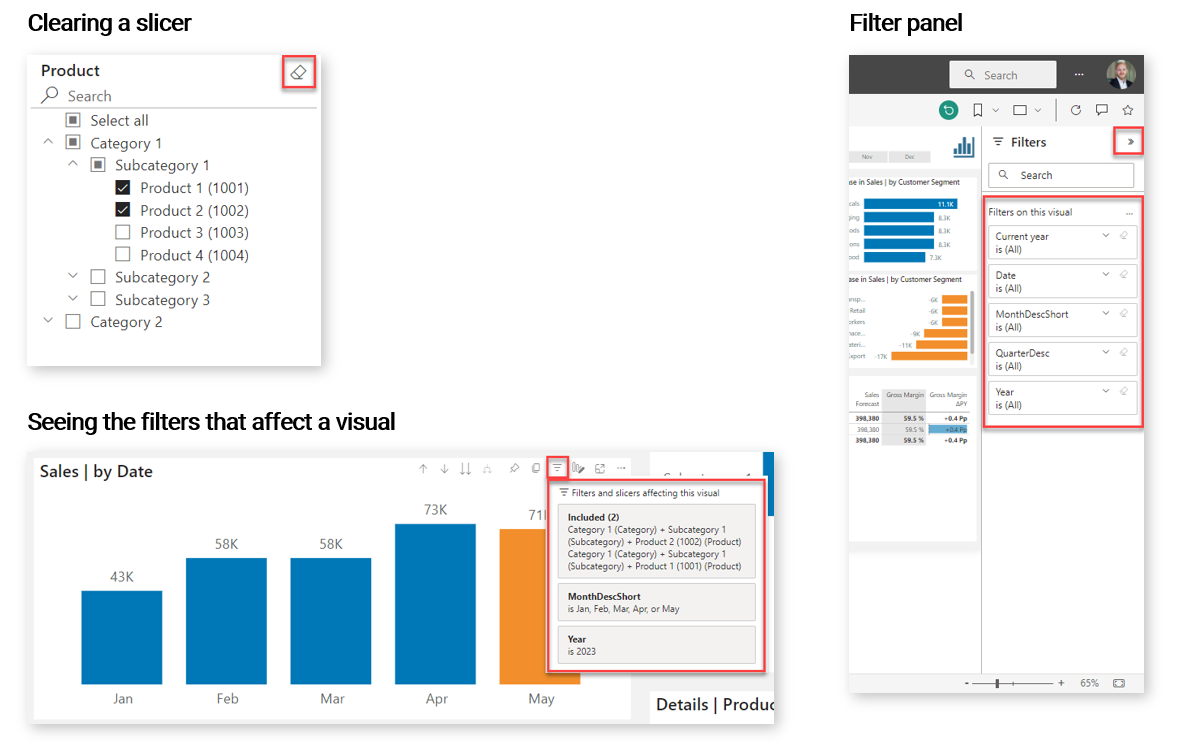
There are a few things I would like to highlight regarding slicers and filter context when working with a report:
- You can clear a slicer using the eraser symbol when hovering over the slicer
- You can see which filters currently affect a visual using the funnel symbol when hovering over the visual
- You can open the filter panel on the right border of the report and understand which filters may be applied there. Please note, as a report creator you can hide the filter panel for report consumers so it might not be visible in some reports
6.4.4 | Cross-filtering and cross-highlighting
A key strength of Power BI, in addition to the automation aspect, is the interactivity when working with visuals and reports. An experienced report author will design a dashboard in a way that allows the user to explore and analyze data in the most flexible way. This means dynamically drilling down and up hierarchies, changing sort orders, quickly changing filter settings or using the cross-filtering possibility between visuals.
The last feature allows to click inside a visual, e.g. on a single bar in a bar chart or a single row in a table, which will then filter all other visuals on a dashboard accordingly.
There are two modes with which we can use this possibility: Cross-highlighting and cross-filtering. The default setting in Power BI is cross-highlighting and it looks like the following:
Cross-highlighting
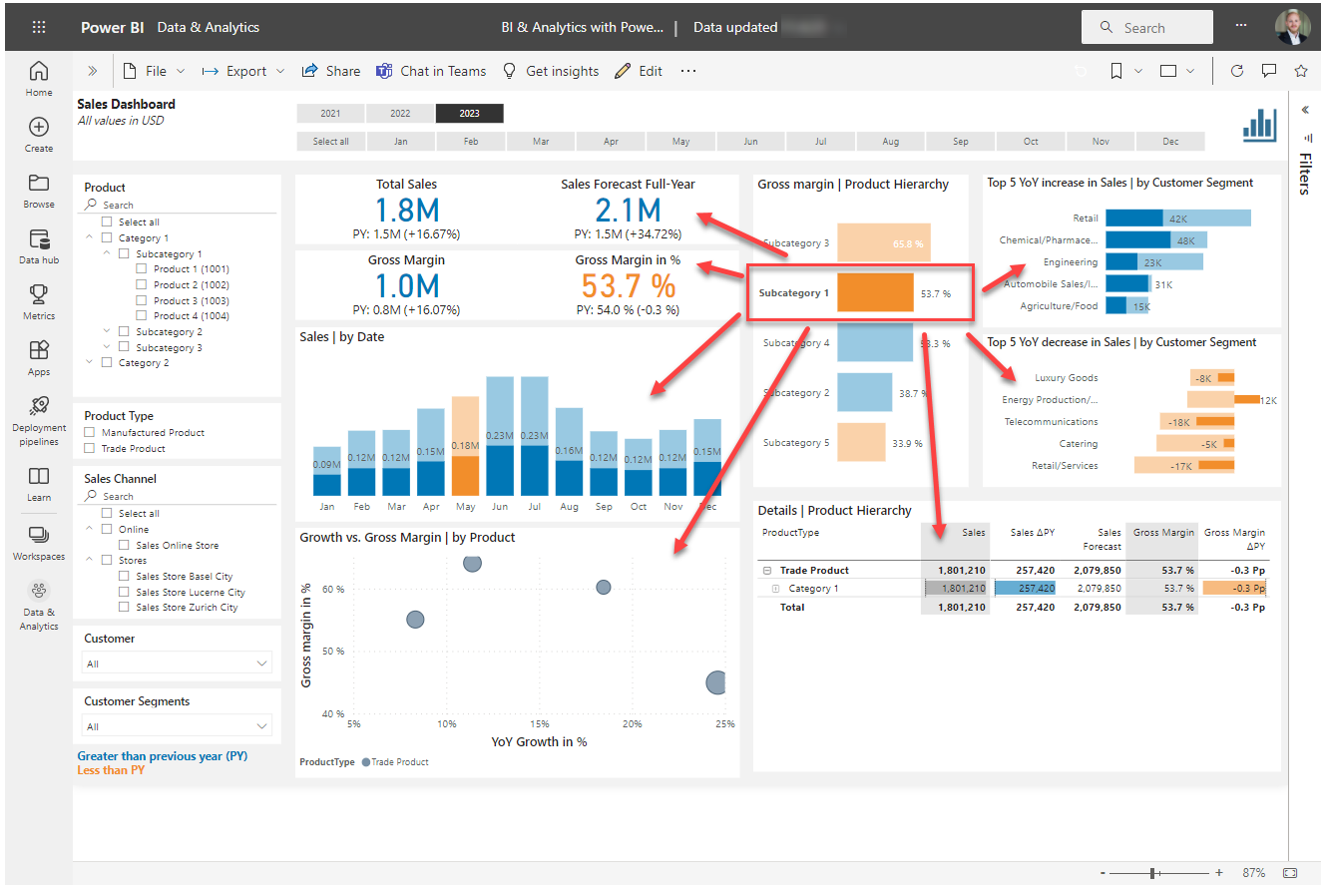
Cross-filtering
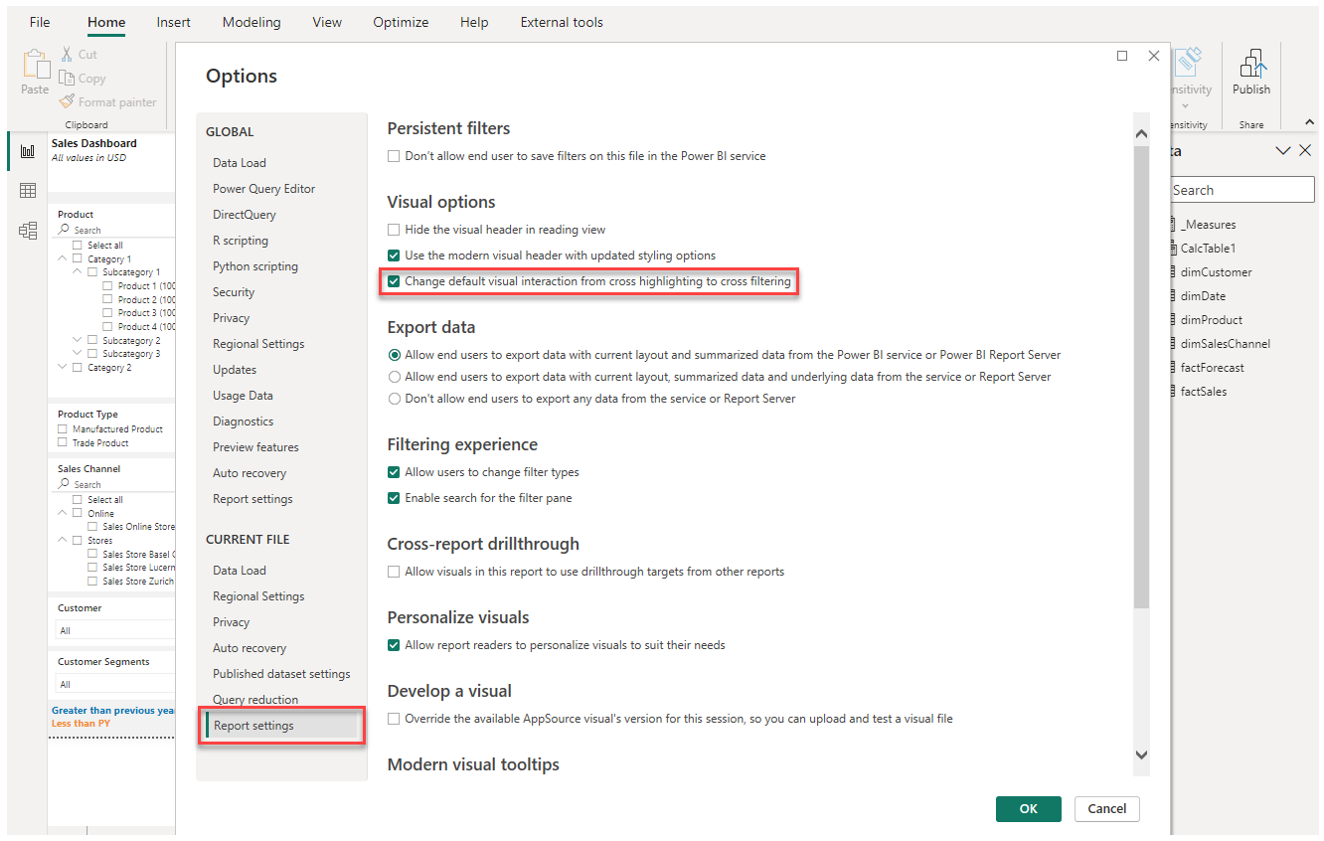
We can change this default setting in the report options to cross-filtering:
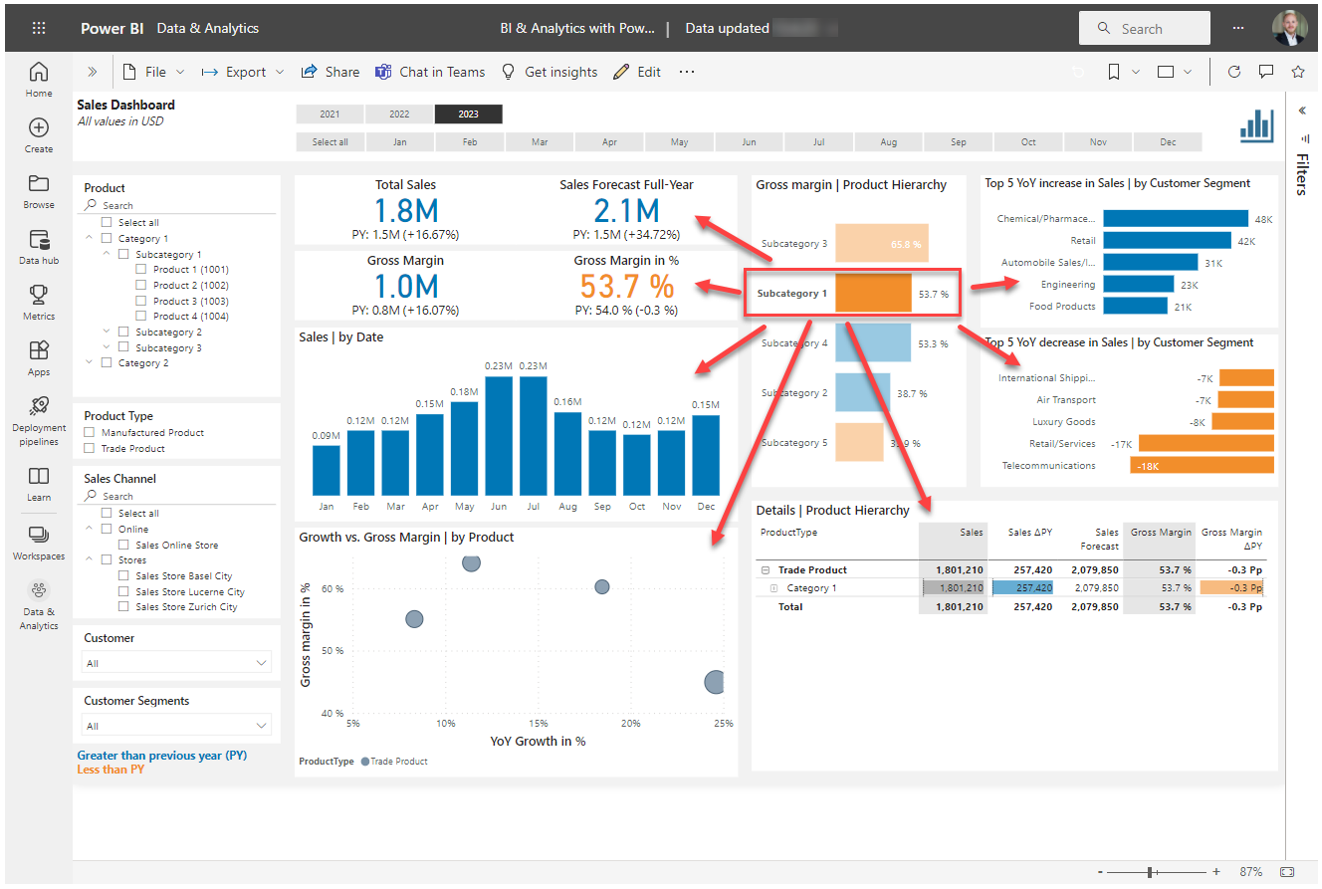
When clicking inside a visual, all other visuals are then filtered accordingly:
Configuring the interactions per visual
Back in Power BI Desktop, we can also control on a granular level how visuals on a report page should interact with each other. To do that, select a single visual and use Edit interactions in the Format ribbon to activate the configuration:
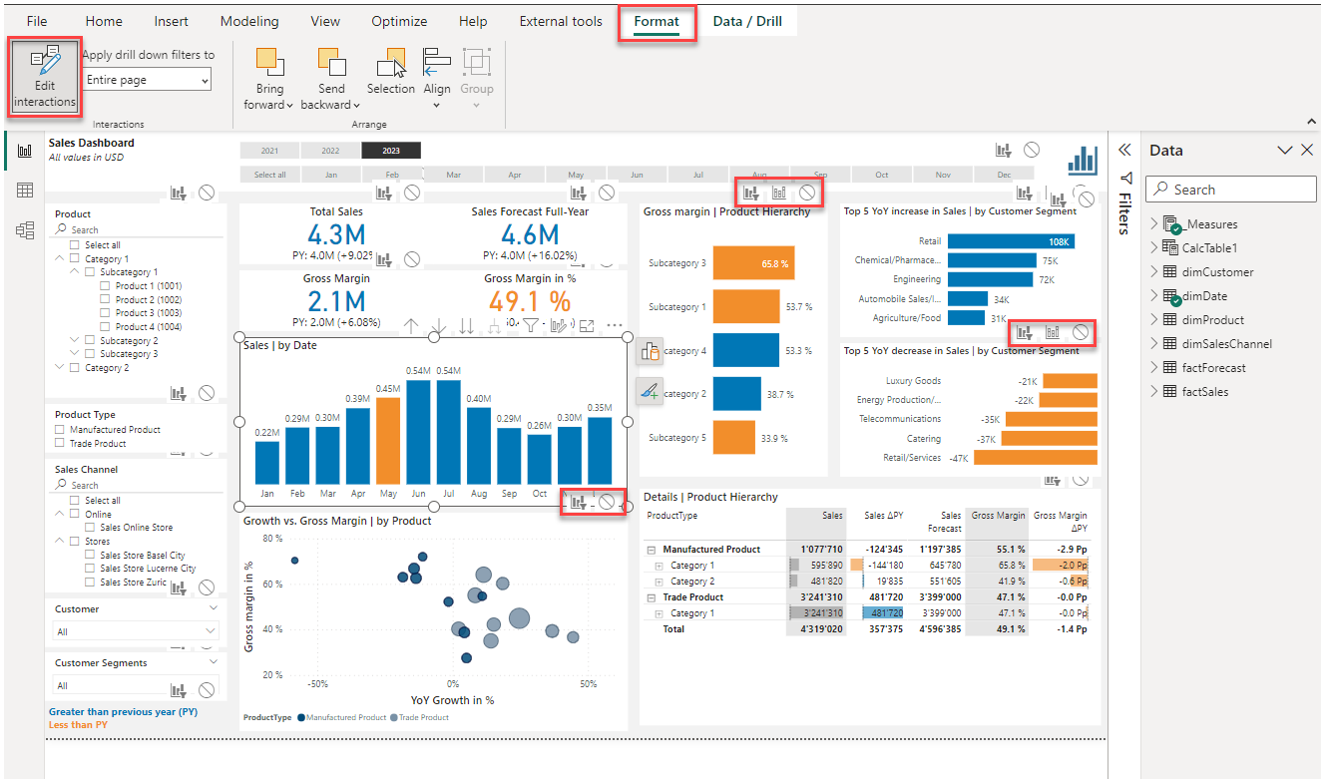
For each visual, we can select (1) cross-filtering, (2) cross-highlighting or (3) no interaction at all.
6.4.5 | Personalizing a visual
A report author can allow report consumers to change visuals when working with a report in the Power BI Service without actually changing the report itself. This option can be activated in the report options in Power BI Desktop under File → Options and settings → CURRENT FILE → Report settings → Personalize visuals.
In the Power BI Service, when hovering over a visual, we can click on the respective symbol to start personalizing the visual:
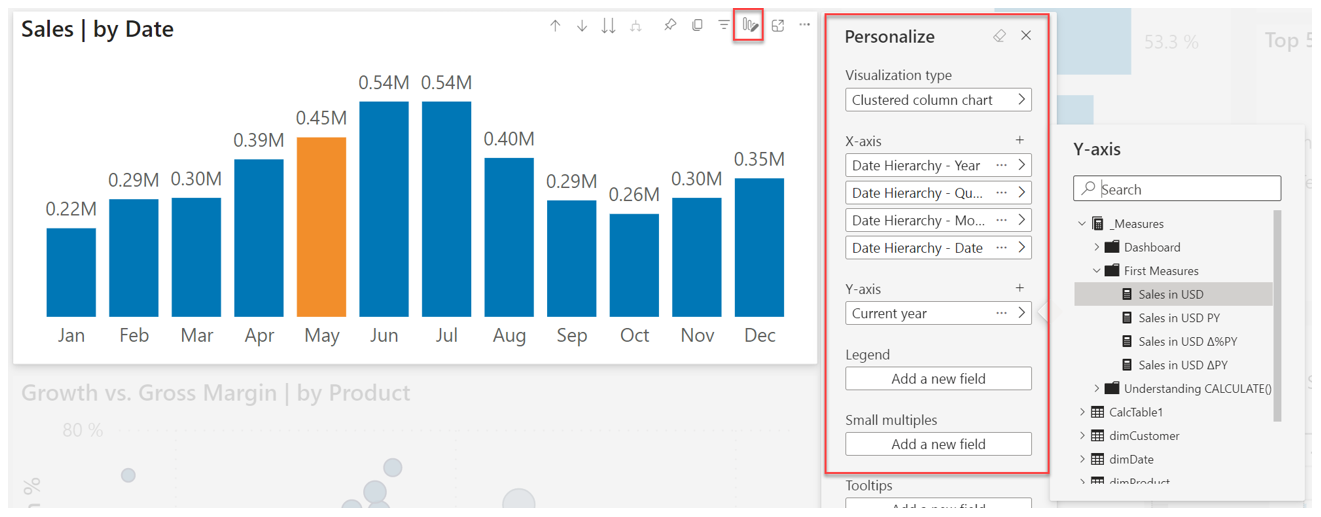
The feature allows a report consumer to change the dimension and measure fields and even the visualization type. It has to be noted though that a user working with this feature has to understand the data model, i.e. which dimension fields and measures she can use. In particular working with the correct measure can be a challenge as they often have specific logic and filter contexts embedded.
6.4.6 | Exporting data from a visual
When working with a report in the Power BI Service, I have the possibility to export data from a given visual. To do that, simply click on the three dots in the top right corner of a visual and select Export data:
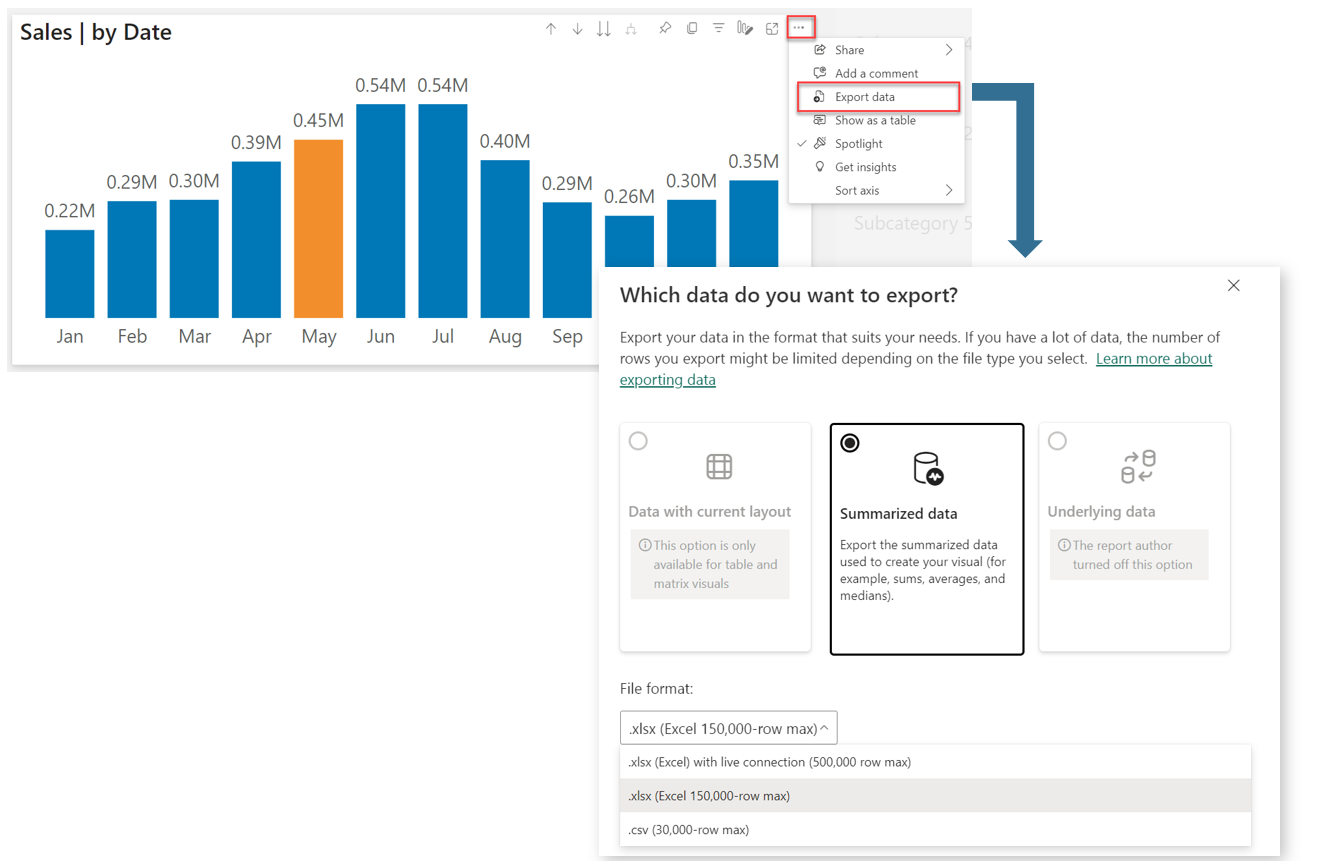
There are different options available regarding the scope and format of the data export. Ideally, you test all of them to get a feeling for it. The newest feature is to export data to Excel that has a live connection to the data. So if the data in the dataset changes, the export can be refreshed accordingly.
Please note, the report owner can prevent data exports in the report settings or deny the export of underlying (detailed data). Further, who can export data can enabled or disabled in the Power BI tenant settings either for the entire organization or for specific security groups.
6.4.7 | Analyzing data in Excel
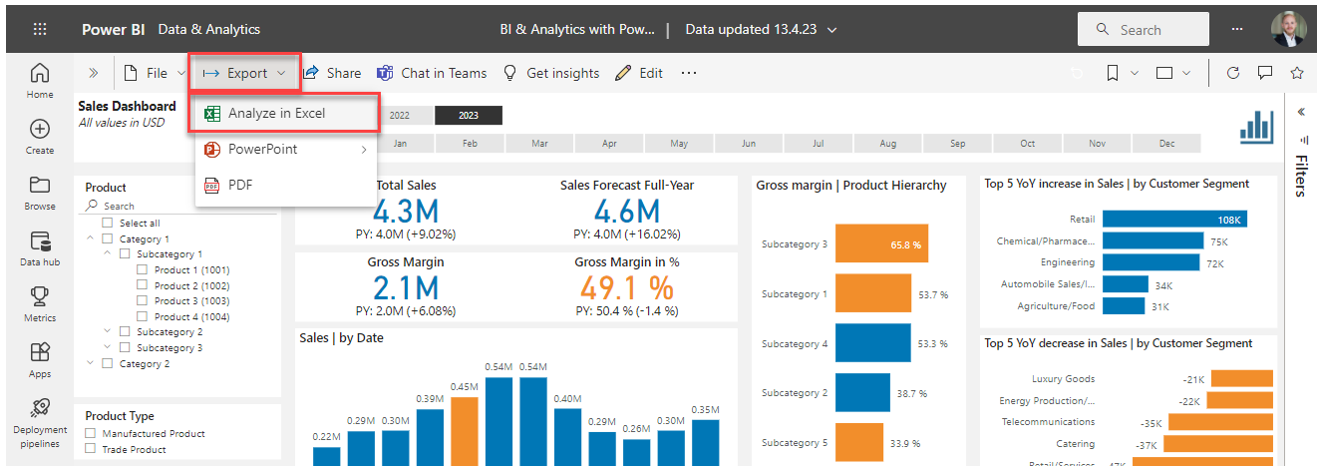
One of the key strengths of Power BI is the integration with other applications part of the Microsoft 365 platform. One example of that integration is the possibilty to have a live connection from an Excel workbook to a published dataset to build data tables using pivot.
In a given report, use the Export button and then Analyze in Excel to open an Excel workbook with a live connection to the dataset:
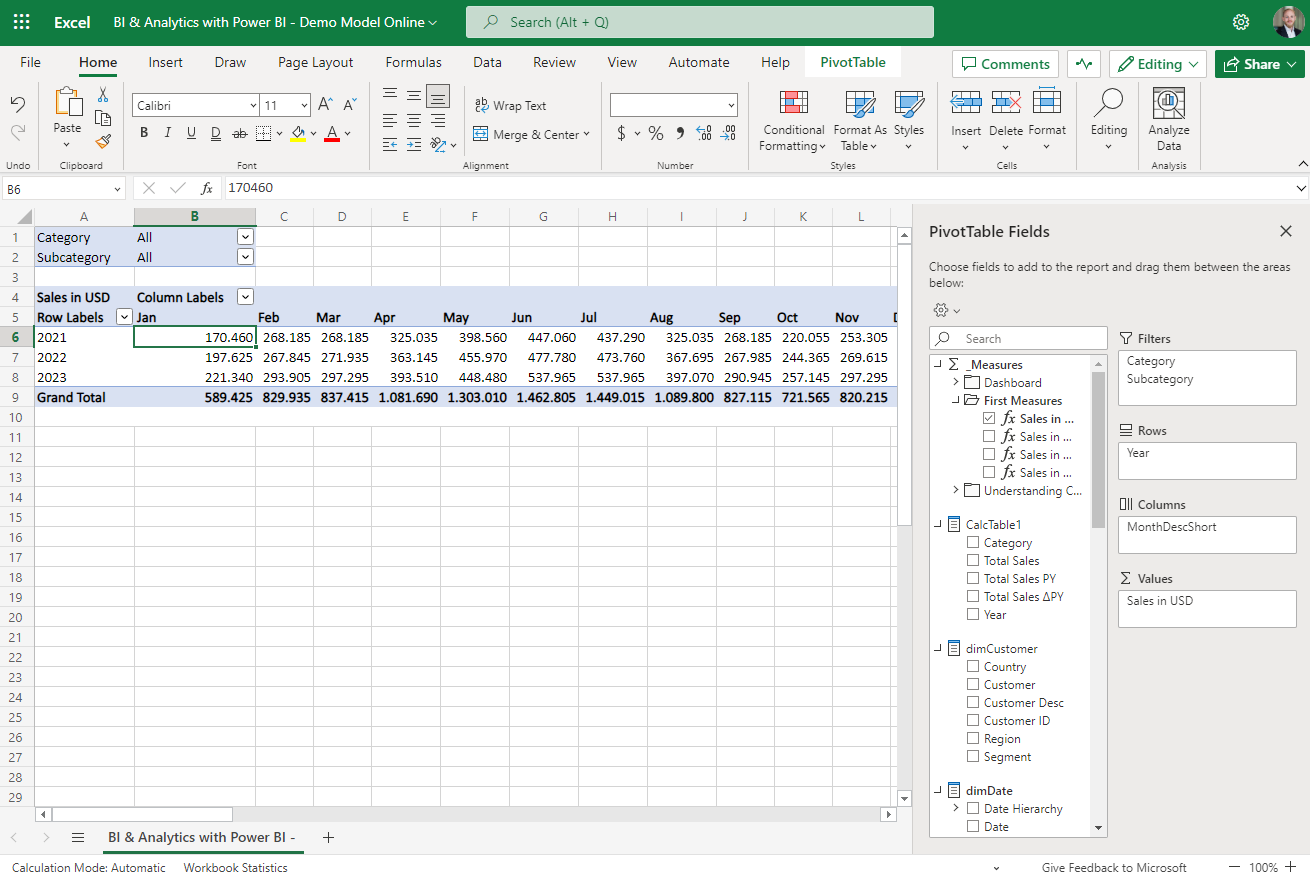
In the Excel workbook, you can then use the fields and measures of the dataset to build and filter pivot tables:
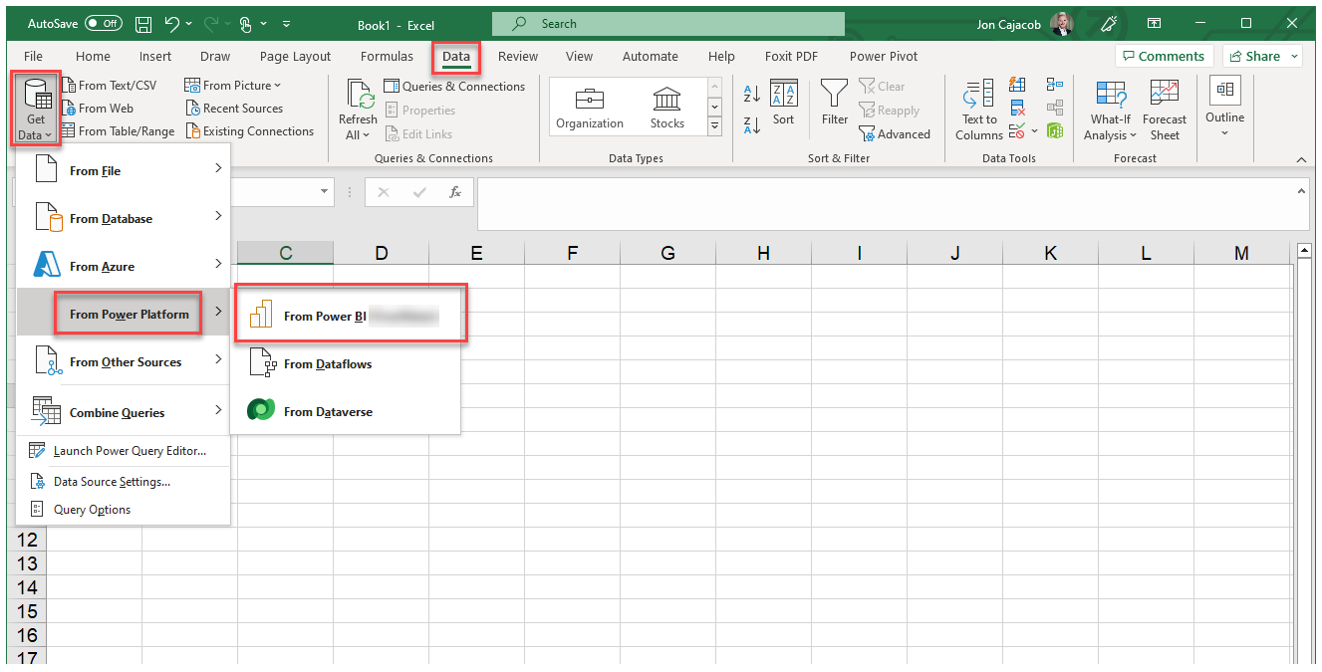
Alternatively, you can also establish a data connection to a published dataset directly from within an Excel workbook. Make sure you are logged in with your Microsoft 365 account in Excel.
6.4.8 | Embedding reports and visuals in PowerPoint
A rather new feature available is the embedding of a report page or single visual in PowerPoint with a live connection to the dataset. The report can then be used inside PowerPoint as if it would be in the browser, i.e. we can use all the interactivity like filtering or highlighting accordingly.
Prepare PowerPoint (Power BI add-in)
First, you have to get the Power BI add-in in PowerPoint as following:
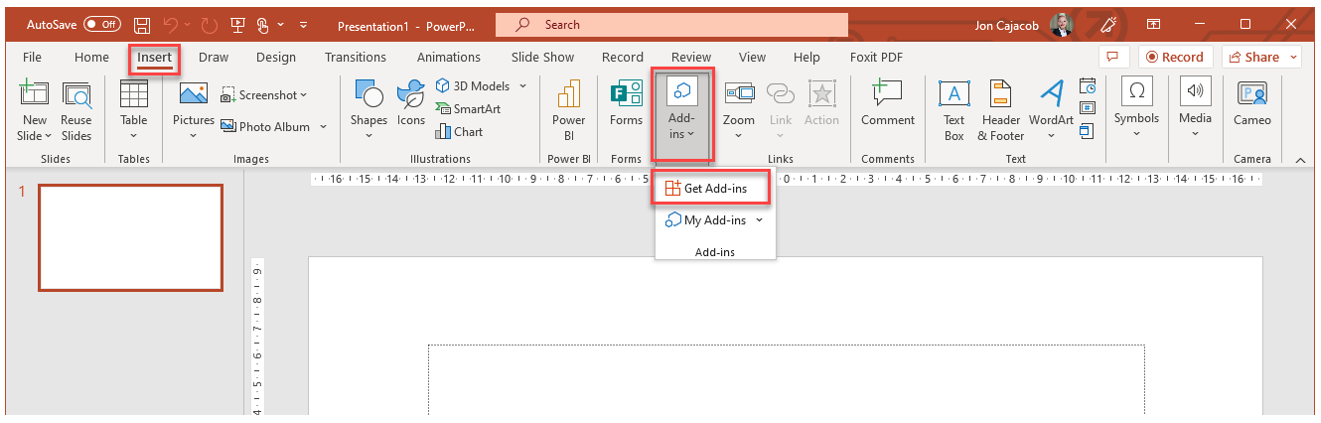
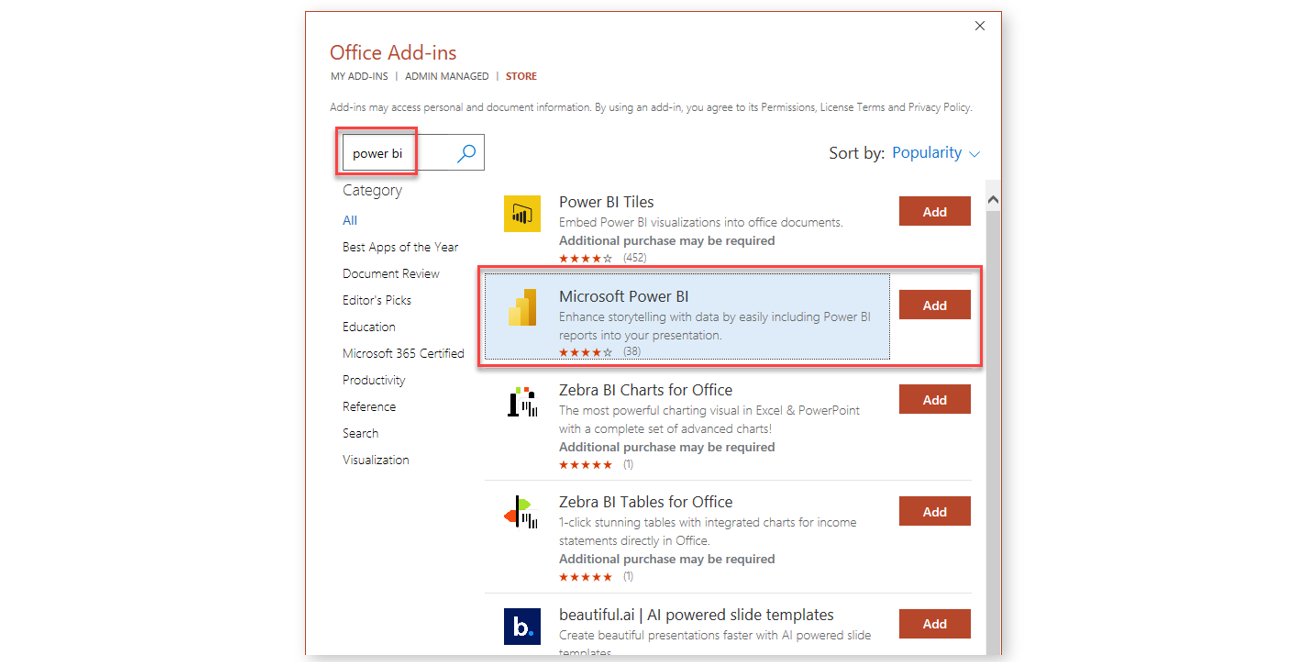
In the new window, search for "power bi" and then add the add-in accordingly:
Embedd a report page
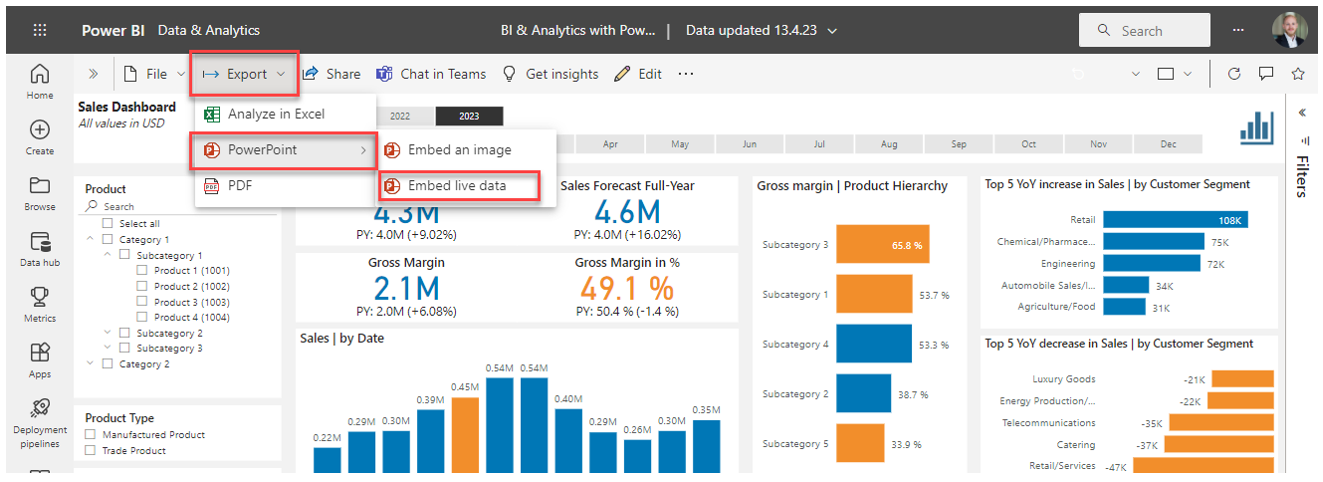
To embed a report in PowerPoint, use Export in the report header and then PowerPoint and Embed live data:
In the appearing window, select Open in PowerPoint:

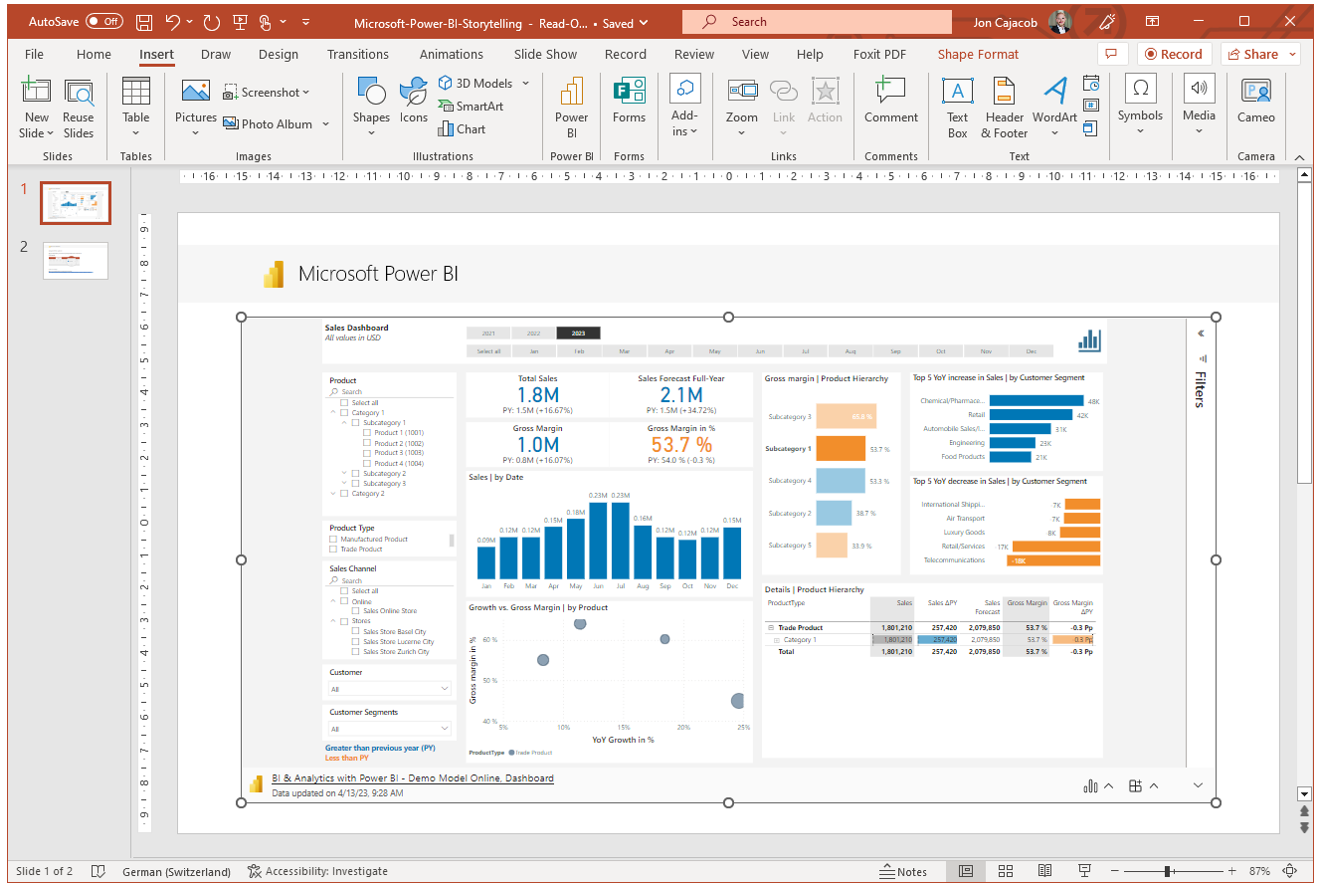
A new PowerPoint file will be created with the report page embedded:
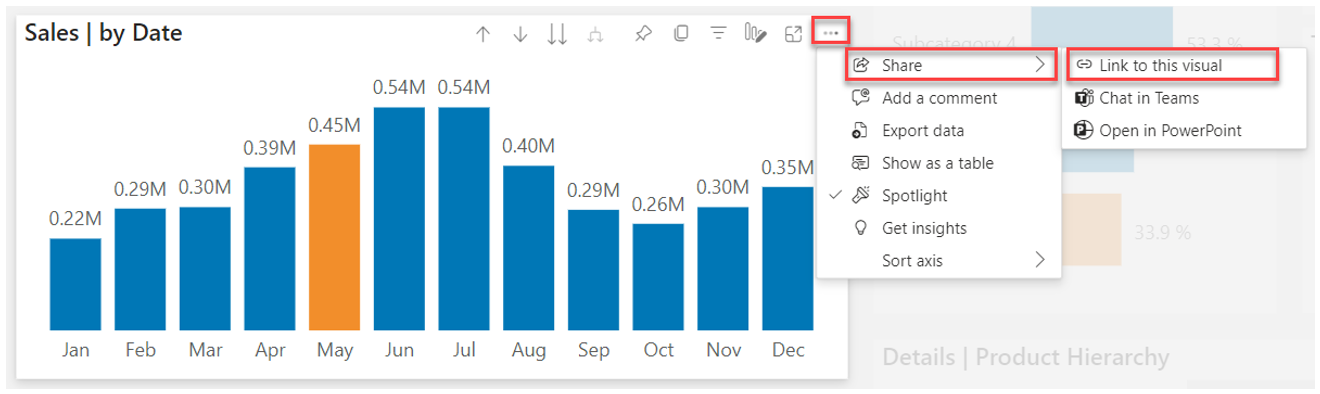
Embedd a single visual
You can also embedd single visuals. To do that, use the three dots in the top right corner of a visual and then select Share and Link to this visual. In the new small window, copy the URL to your clipboard.
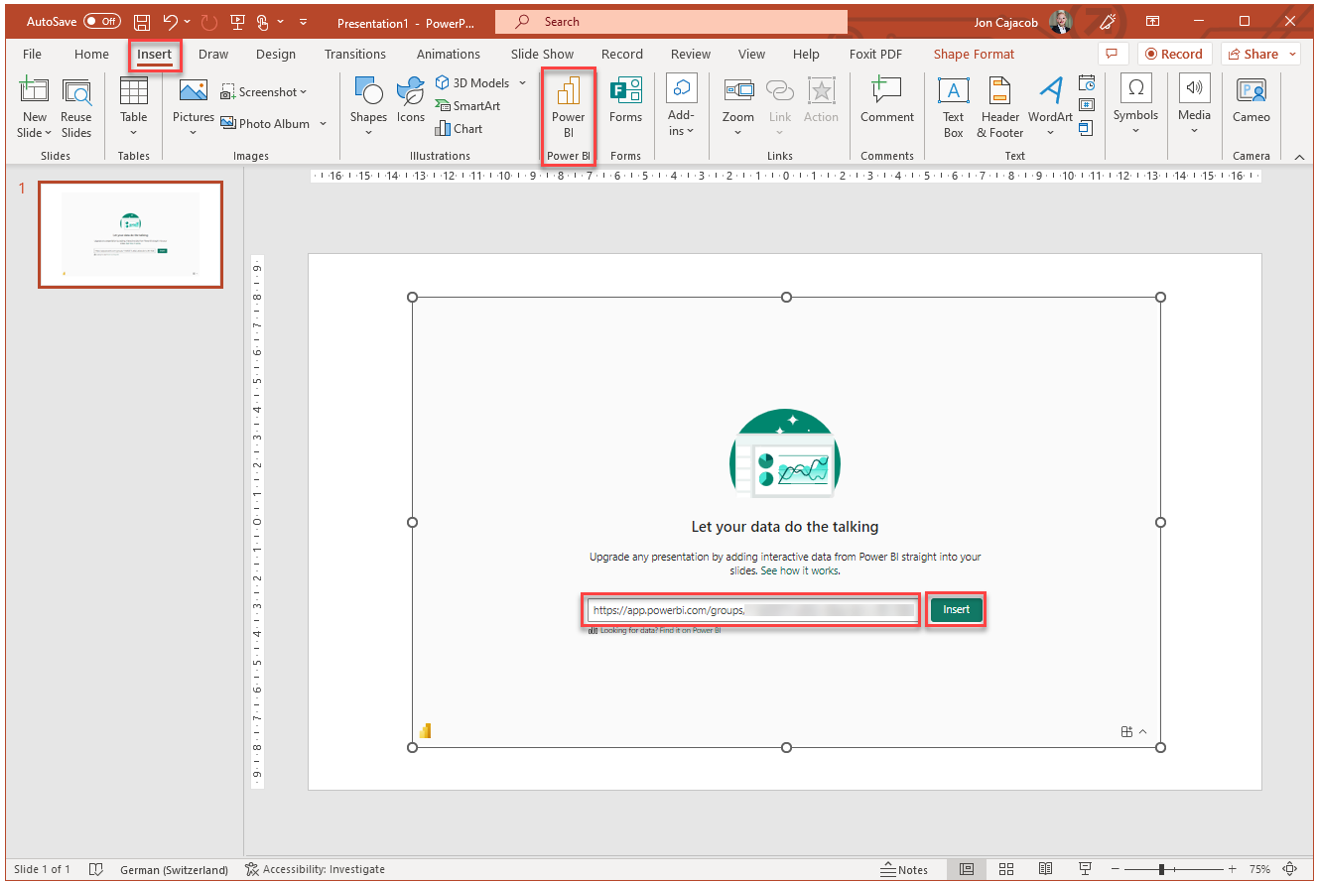
Back in PowerPoint, insert a new Power BI container to a slide, paste the URL into the container and click on Insert:
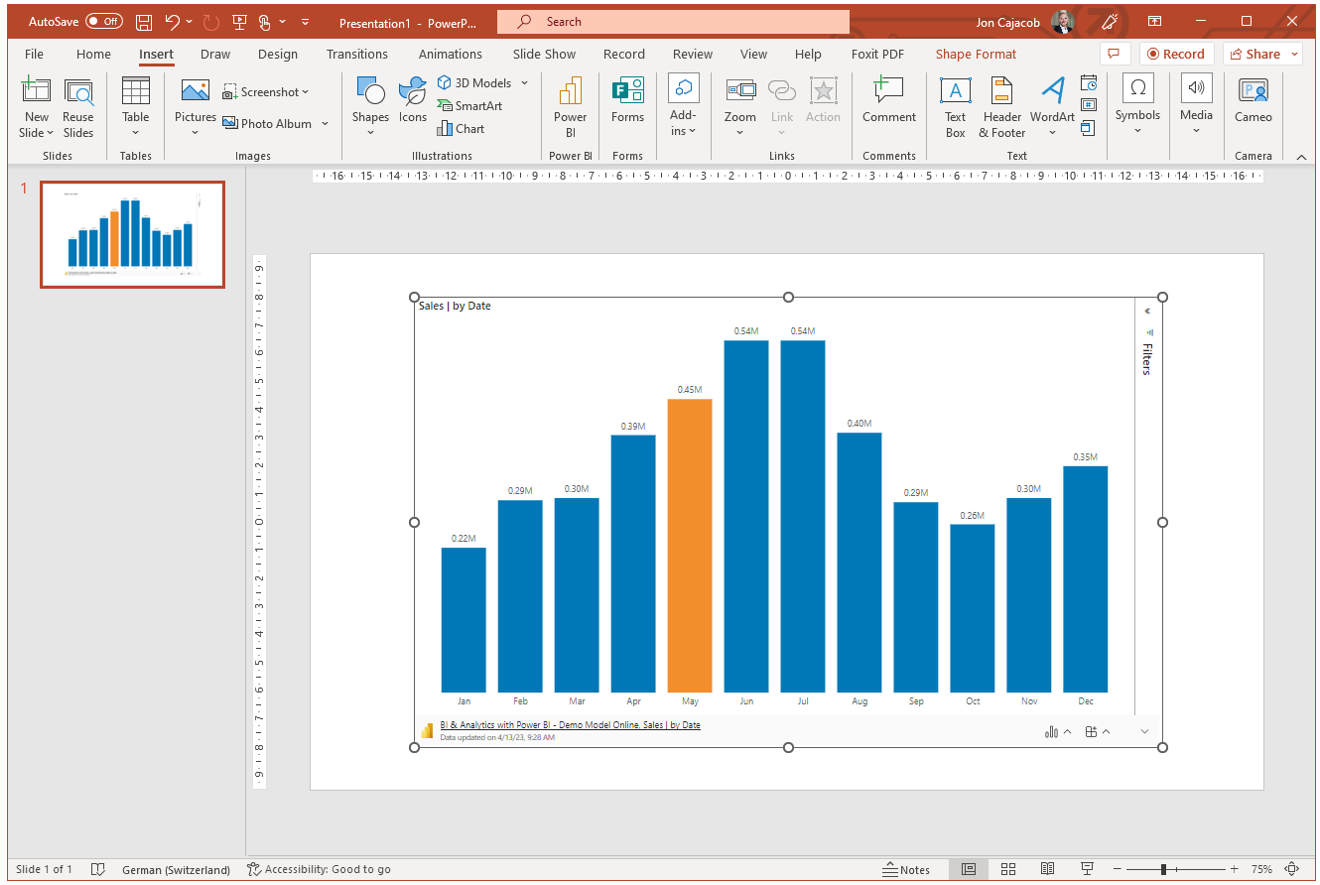
The single visual should now be visible:
6.4.9 | Using the report URL
When having a report open in your browser, the URL you see will always directly lead to the report and the report page that you have currently open.
Given that, you can for example save the URL under your favorites in your browser in order to quickly access the report with one click. Or you could send the URL to a colleague that has access to the report.
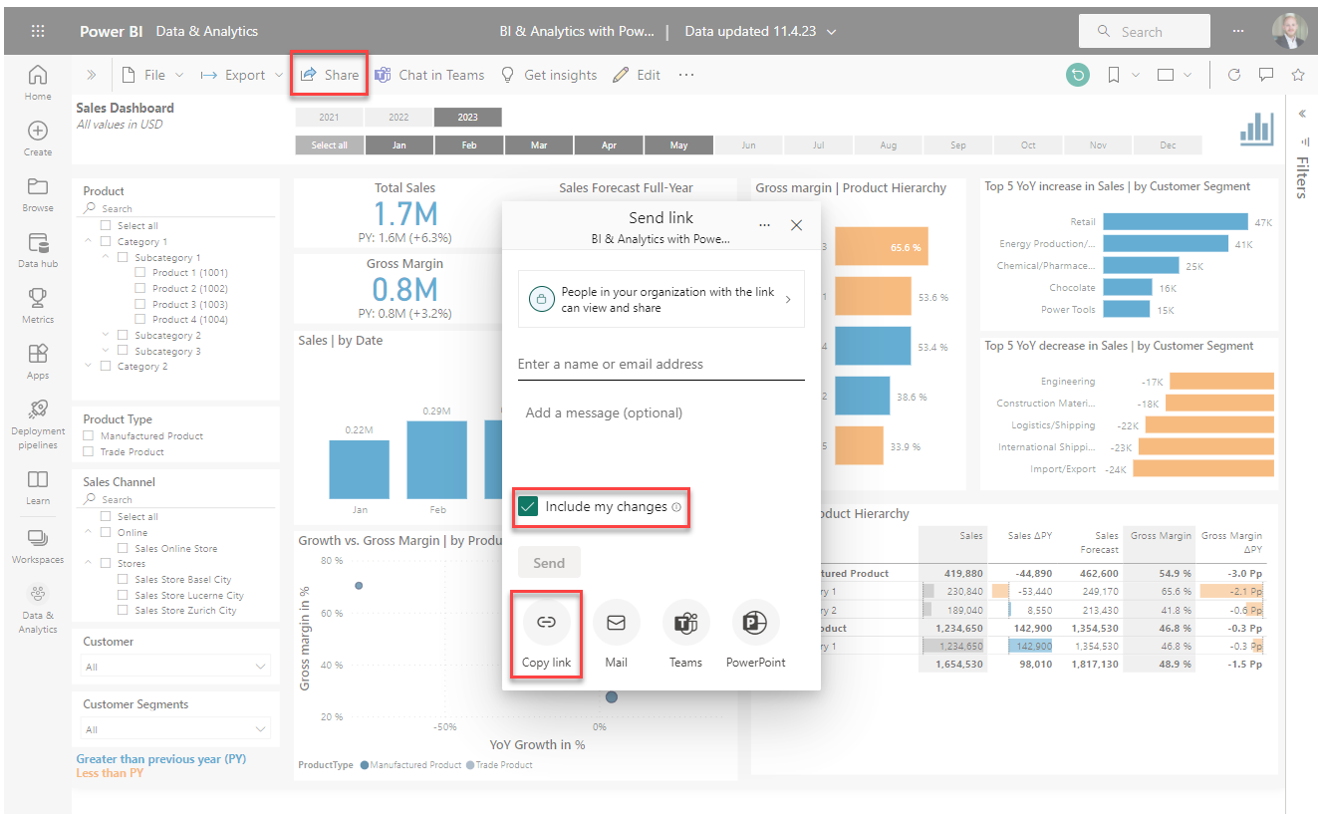
If you want to share a report in a certain state, i.e. with certain slicer settings, use the Share button in the report header section to create a shareable link in the appearing window:
6.4.10 | Other features worth mentioning
Other features worth mentioning are:
- You can export a report to PDF via Export → PDF in the report header
- You can subscribe to a report (see the report header), which means an e-mail will be automatically be sent to you with a certain frequency. This is useful to remind yourself looking at the latest data in a report
- You can create bookmarks in your report that will capture the current state of the report, e.g. filter settings
- You can embedd a report in a Microsoft Teams channel as a separate tab
- You can embedd a report in a public homepage. Of course you only want to do that with data than can be shared with the public