6.6 | Row Level Security (RLS) implementation
6.6.1 | Introduction
With a Row Level Security (RLS) mechanism we want to define which user can see which rows in our data model. Essentially, we are evaluation who is currently looking at a report and based on that we limit the rows that are returned an visualized on the report canvas. Please note the difference to previously discussed access permissions and roles on Workspaces, Semantic Models and Reports where we define who can see which object in the Power BI Service.
Usually, RLS is defined based on some organizational dimension, like for example business unit, legal entity, profit or cost center or based on a regional structure. As a prerequisite, the relevant organizational dimension of course has to be part of the data model.
Understanding how the implementation of RLS in Power BI specifically works is best achieved with looking at an example.
6.6.2 | Example
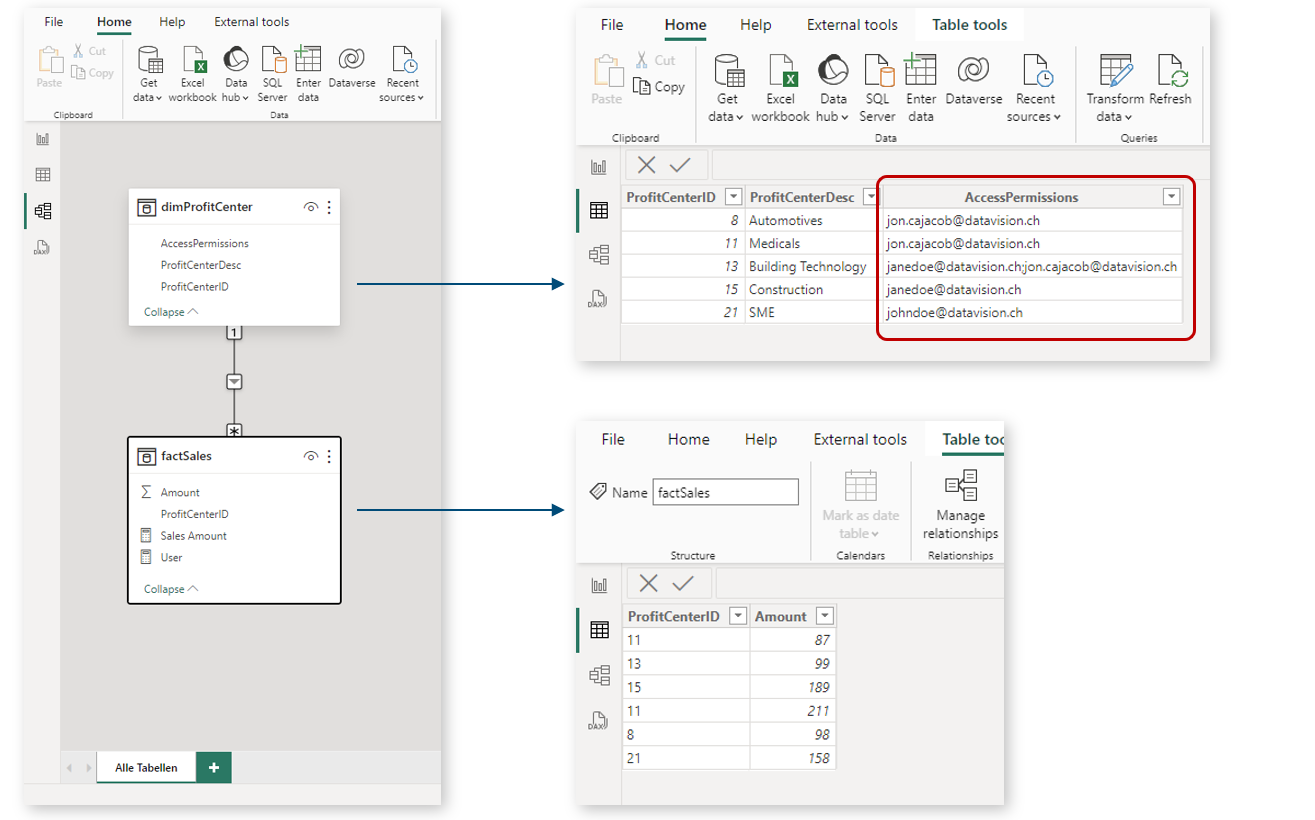
Let's assume a very simple data model which has a dimension table dimProfitCenter that filters sales data factSales. Who can see which profit center is defined in a column AccessPermissions, please refer to the following screenshot to see how the example data model looks like:
To define and activate RLS in this model, we do the following:
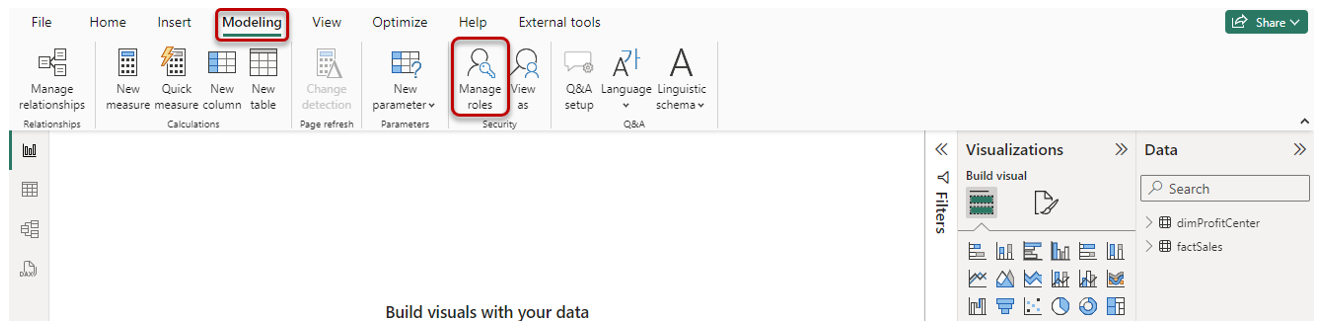
1. In the Report Builder, via Modeling → Security → Manage roles, open the RLS role manager
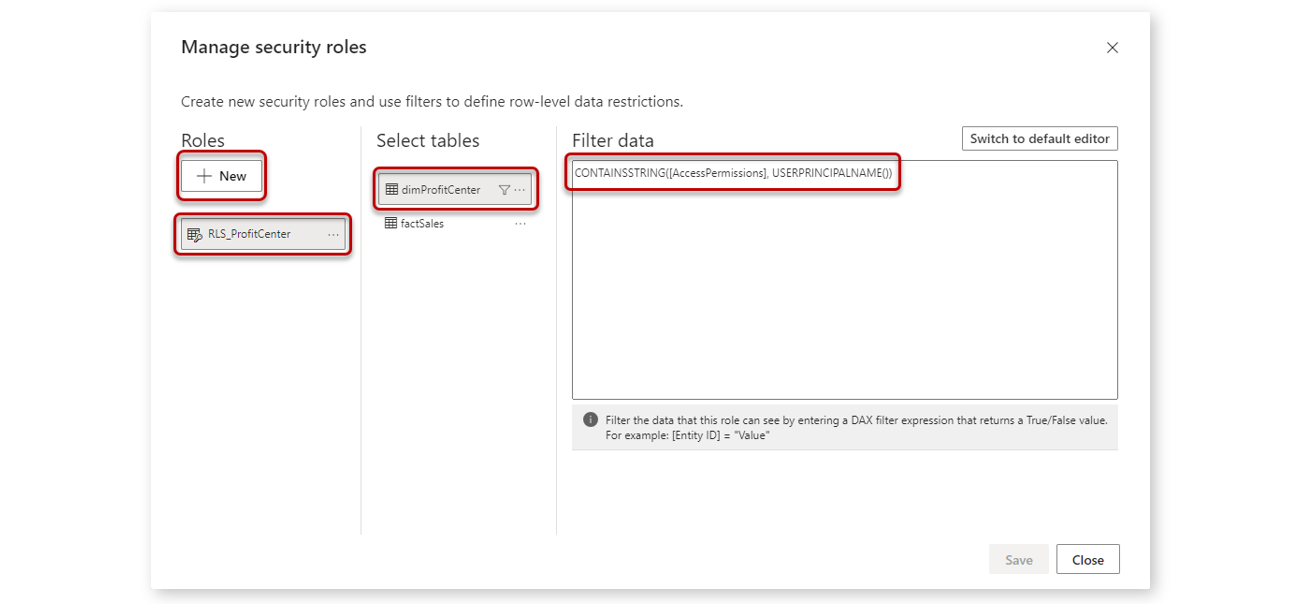
2. Create a new RLS role with a bit of DAX
Well name the new role RLS_ProfitCenter and then navigate to the table dimProfitCenter and enter the following small DAX code snippet (note, you may have to switch to the DAX editor with the button top right):
CONTAINSSTRING([AccessPermissions], USERPRINCIPALNAME())
Then we confirm with Save.
The DAX code we used evaluates the column AccessPermissions if it can find the e-mail address of the user currently looking at the report. The function USERPRINCIPALNAME() returns that e-mail address. If the code finds the e-mail address, it returns True. For all rows where this condition is True, data is returned. And because dimProfitCenter filters factSales, this is also true for factSales.
3. Testing the newly created RLS role
Testing and making sure our RLS mechanism works as intended is important so Power BI has a functionality to exactly do that.
Via Modeling → Security → View as we can look at the report from a specific role's (and user's) perspective.
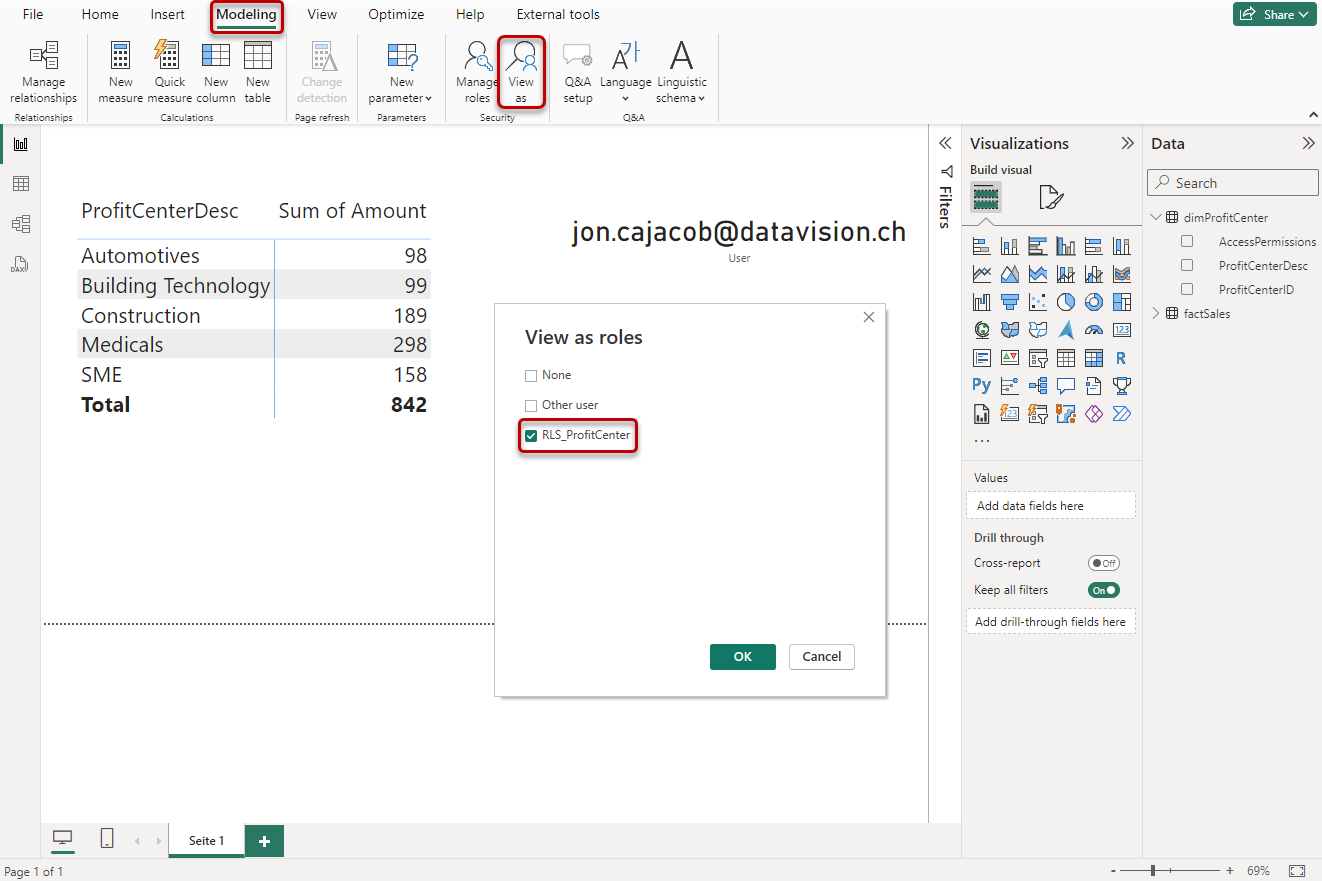
After confirming, the report is filtered according to the rules of the RLS role:
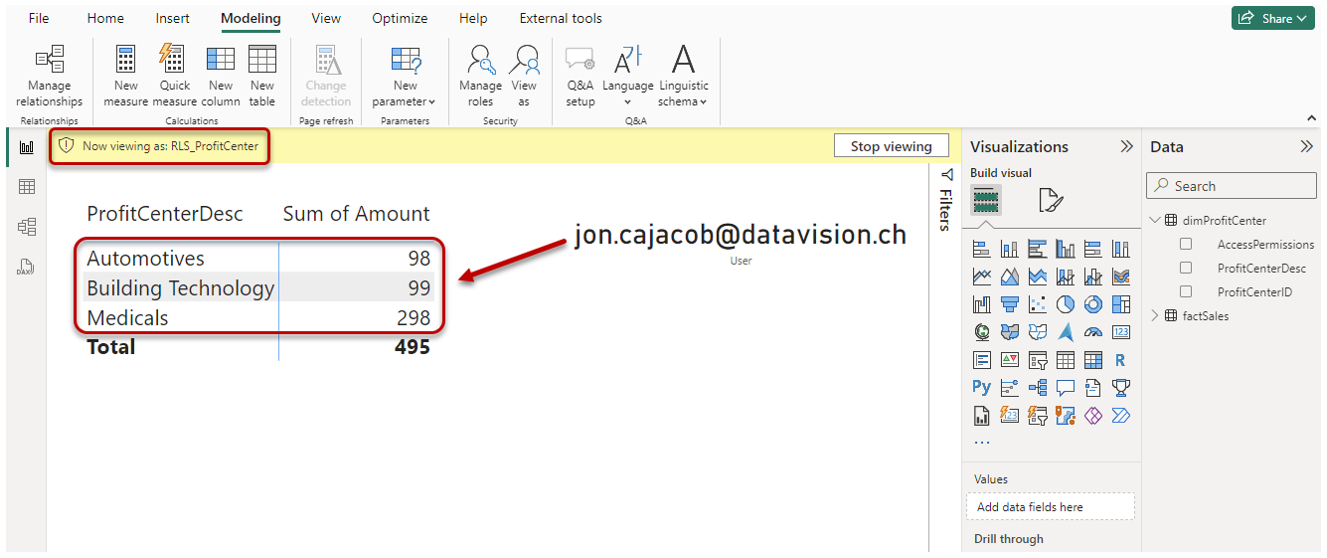
Please note, the e-mail address seen on the canvas is based on a simple DAX Measure with the following code:
User = USERPRINCIPALNAME()
4. Adding users to RLS roles in the Power BI Service
After publishing our Semantic Model and Report with the RLS mechanism, we have to add users to the created RLS roles. Before that, users cannot see any data.
To do that, we navigate to the Workspace and then click on the three dots of the Semantic Model and select Security:
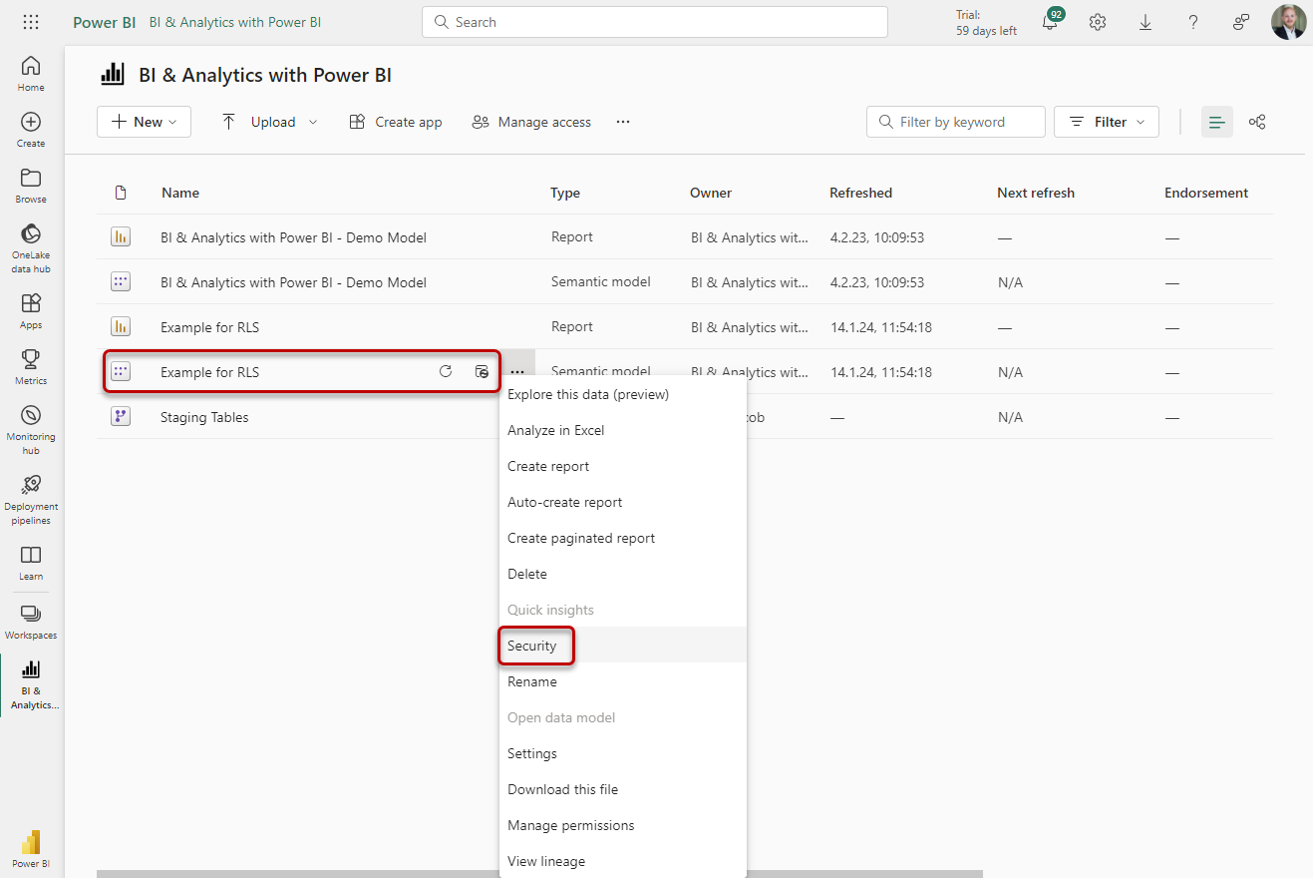
In the window, select the RLS role and add the respective users. Confirm with Save:
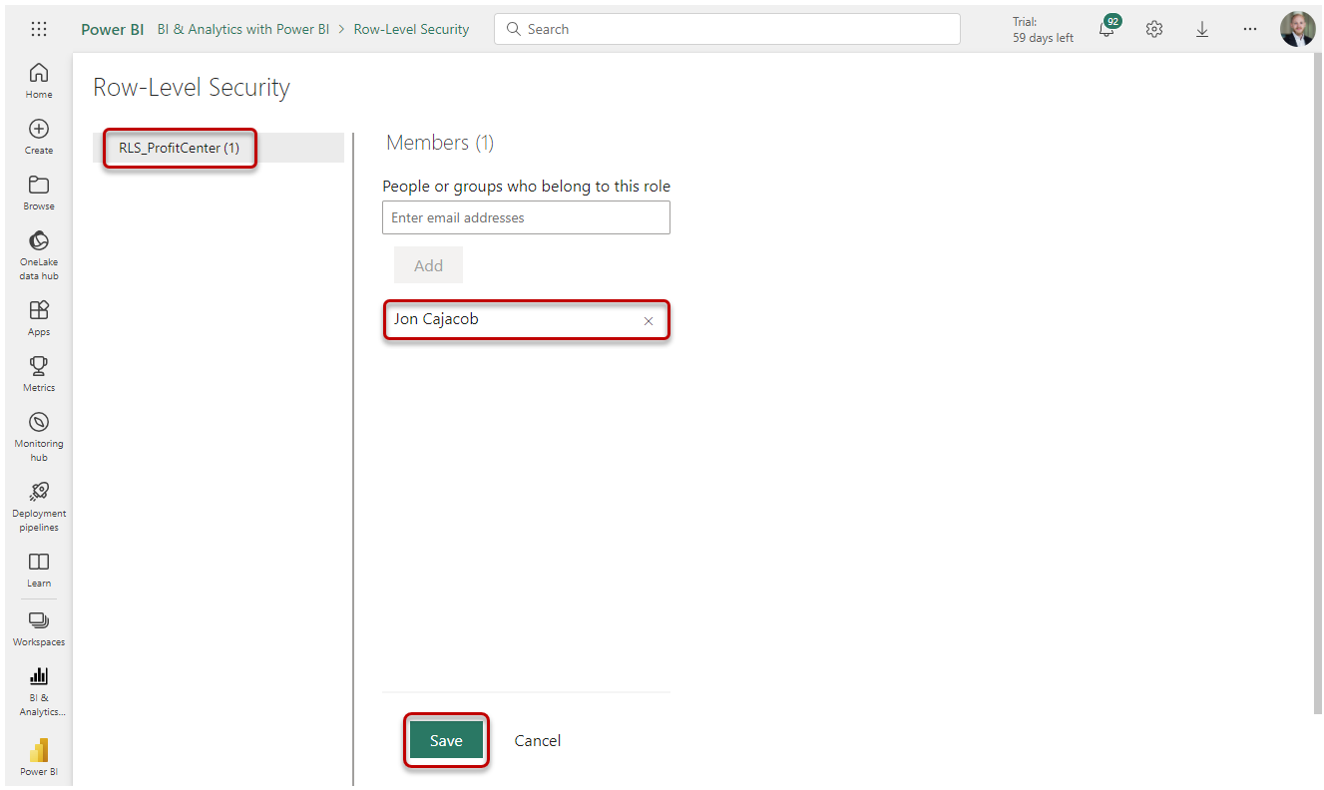
Please note, we can also work with Security Groups here, which are created and managed in the Microsoft Admin Center.
Bonus: A more simple but static way of RLS
To understand the RLS role manager a bit more, let's have a look at another way of defining a RLS role. Instead of using a DAX function that dynamically evaluates a column, we can just simply fix the data scope for a specific role, see the following example:
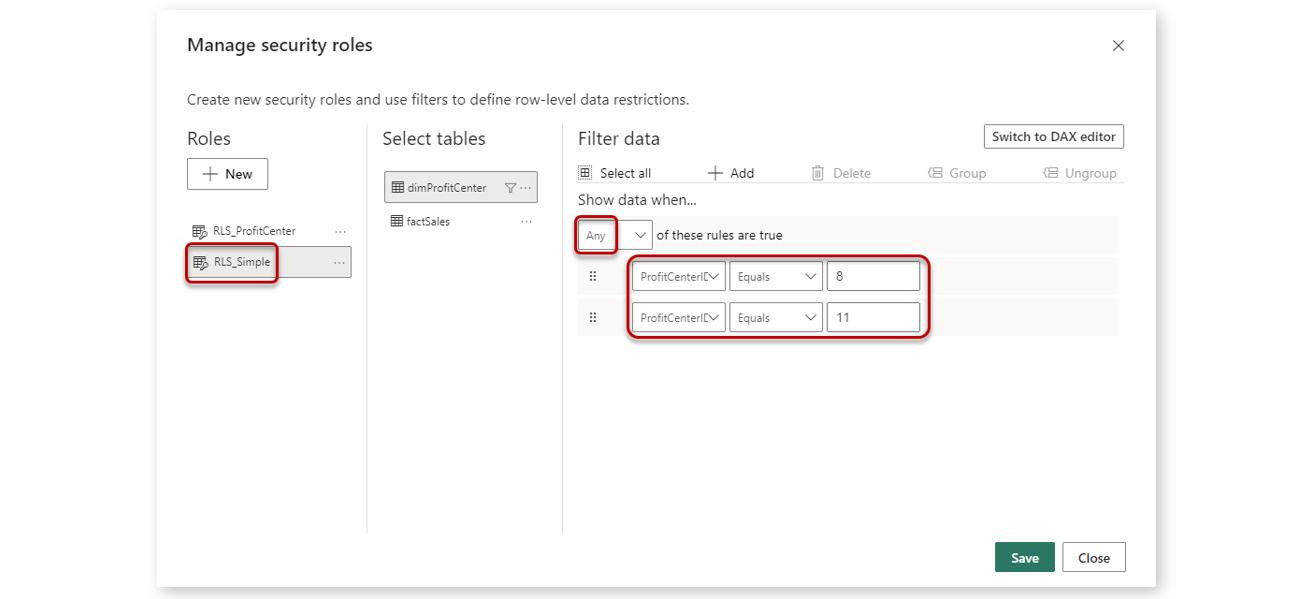
All users that are part of the role RLS_Simple, will only see the profit centers with ID 8 and 11.
Download the PBIX with the RLS example
The PBIX with the just introduced example can be downloaded from my repository here: File repository on GitHub
6.6.3 | Multiple RLS roles
Finally, please note that when a user is part of multiple RLS roles, the filter conditions of all roles are connected with an OR-condition. That means if for example one role permitts to see the country Switzerland and another role France, that user will see both countries in the reports.
Keep in mind that this may lead to "strange" totals in reports for that user. There are ways to deal with that with DAX Measures, however that exceeds the scope of this book quite a bit.