3.7 | Preparing the sales fact table (factSales)
After preparing the dimension tables, we can now continue with the fact tables for the sales transactions and the sales forecast. Remember, a fact table contains transactional data telling us what has happened when. With the associated dimensions we can describe what has happened in the facts by filtering, slicing and aggregating fact data.
1. Navigate to the table factSales
2. Delete the automatically generated step Changed Type
3. Select the columns needed
Select only the following columns:
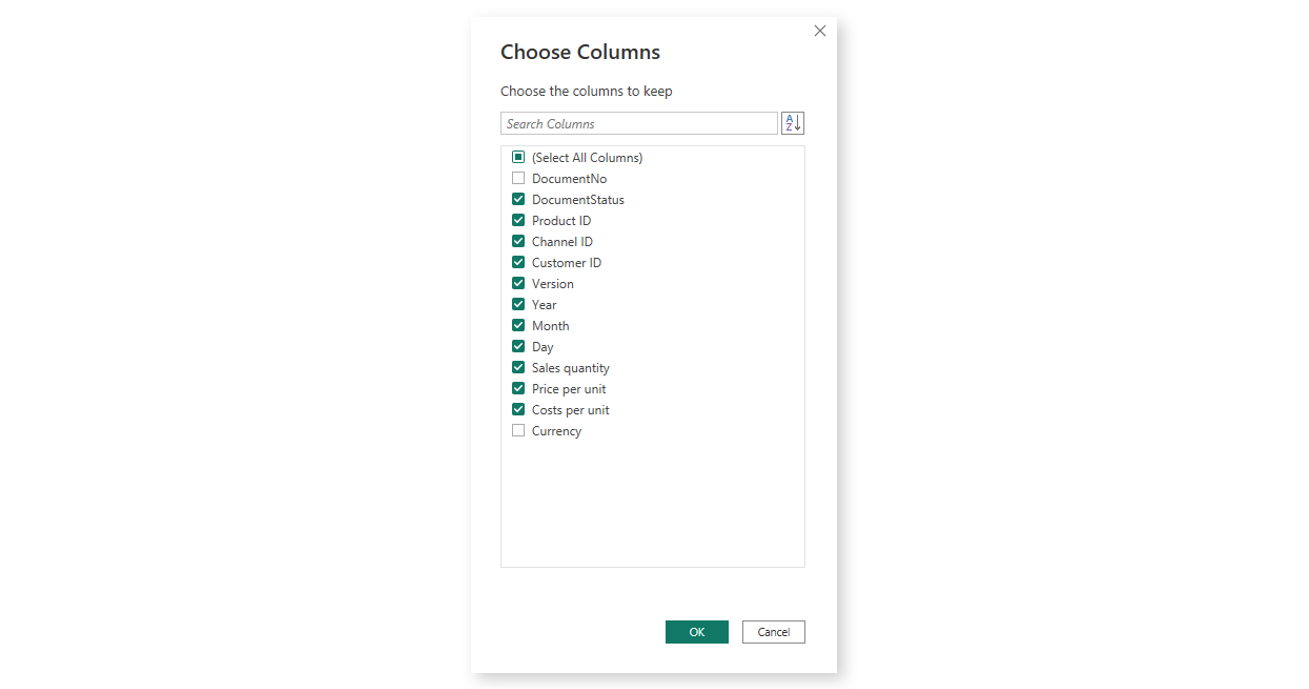
The column Document ID is not needed for the later analysis and in fact would only use a lot of storage space in our Power BI dataset. Further, all data is in USD so the column Currency is not needed as well.
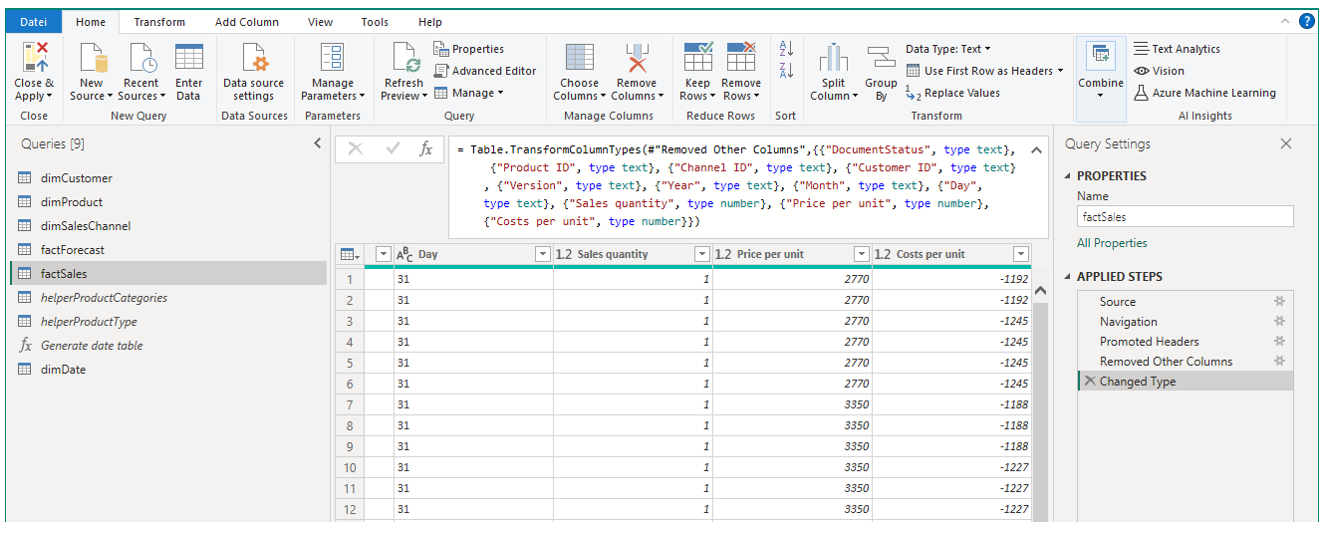
4. Set the data types for each column
Remember, any columns that are not used to do calculations or contain date information, should be of the data type text. This also applies to columns containing IDs which are foreign keys to link factSales with the dimensions we prepared earlier.
The columns Year, Month and Day contain the required information to construct a date field (see below). For now, they need to be of the data type text.
Accordingly, convert all columns to type text, except the columns Sales quantity, Price per unit and Costs per unit which we can convert to Decimal numbers.
5. Filter the table to remove cancelled sales transactions
When preparing any fact table, we need to make sure the scope of data is correct. In our case, there are certain sales transactions that have been cancelled which is flagged in the column DocumentStatus.
Simply click on the small dropdown in the column header DocumentStatus to inspect what distinct values are in this column:
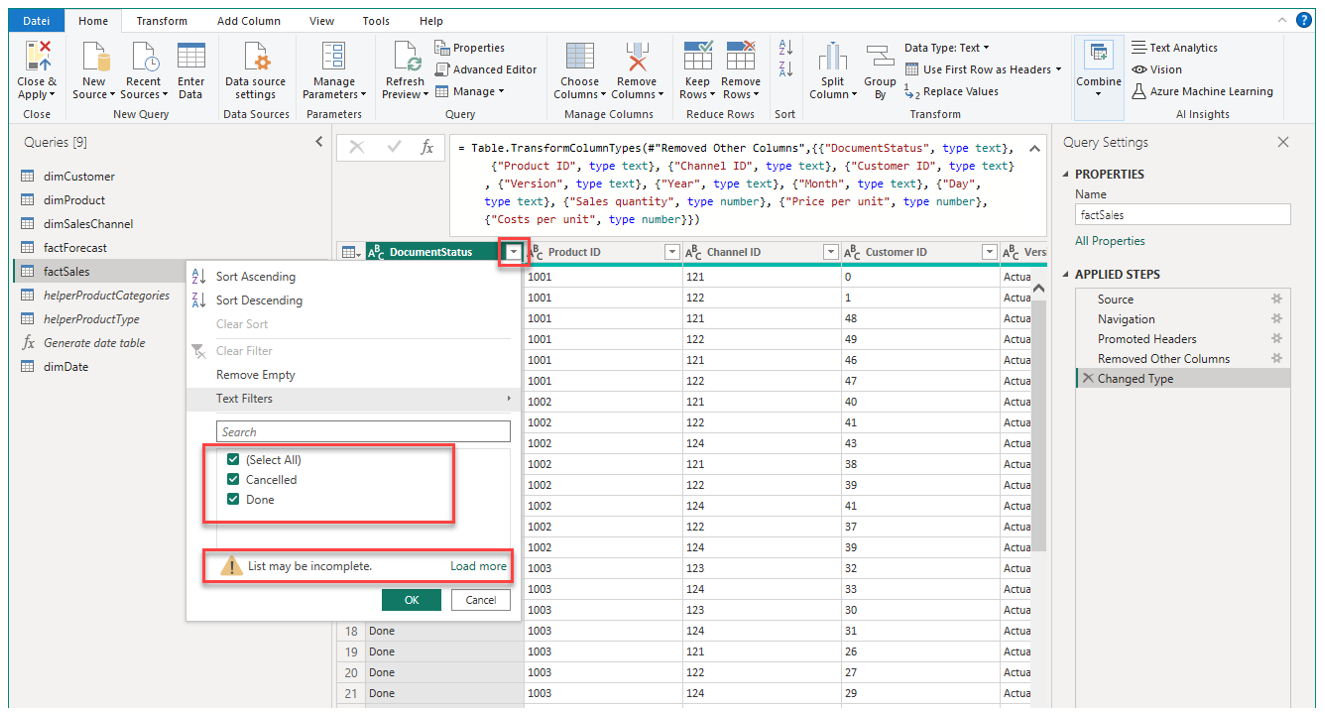
Note, Power Query gives a small warning that there might be more distinct values as Power Query first always shows values based on a table preview of the top 1000 rows. You can click on Load more to make sure all distinct values of a column are shown in the dropdown. Note, this might take a while for very large data tables.
In the dropdown, simply de-select the value Cancelled and confirm with OK.

Under APPLIED STEPS, you should see a new step Filtered Rows. When you double-click on that step (or click on the small cogwheel to the right) you can see the filter rule that has been applied to this column:
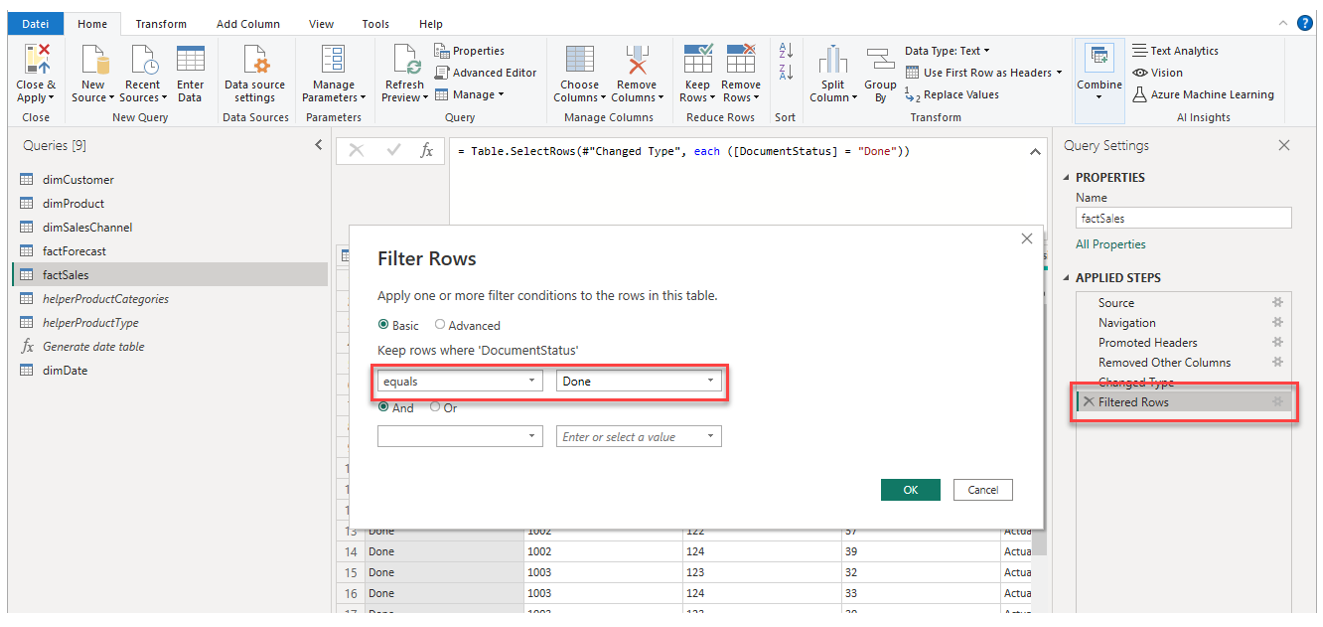
As you can imagine, much more elaborative filter rules can be applied with and / or logic if needed. For now, simply close the window again.
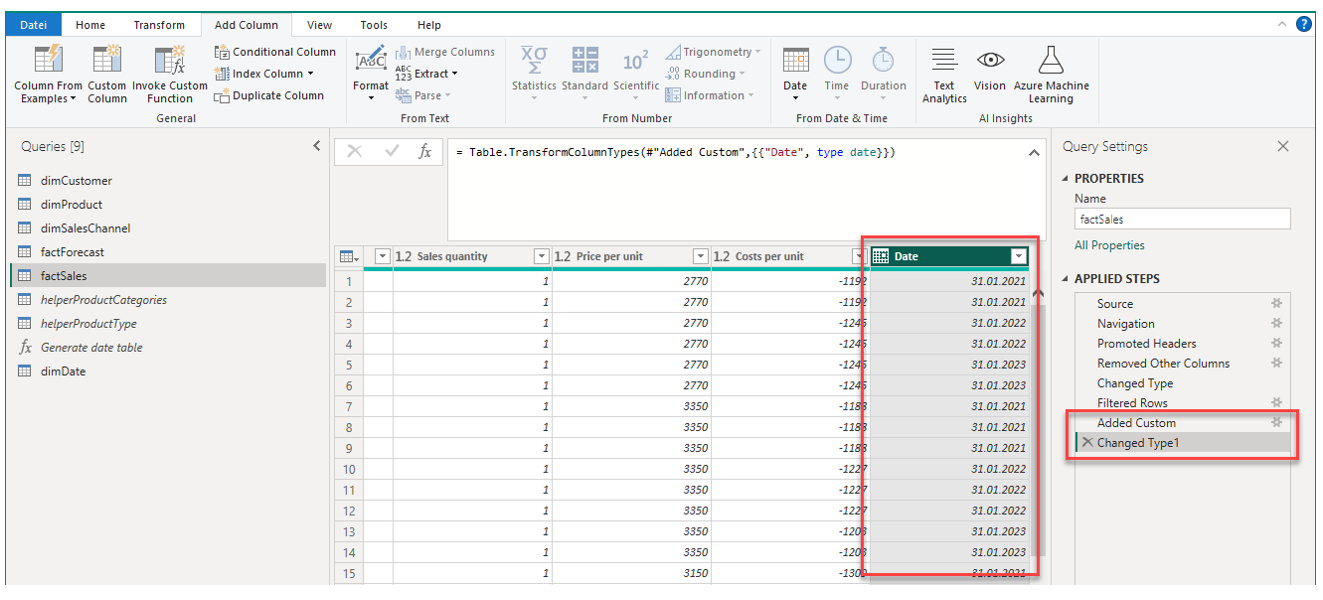
6. Construct a date column from the columns Year, Month and Day
It is a very common issue that the date information in a fact table is either split into multiple columns or in an exotic format that is not easily readable by a BI software. The former is the case for us so we have to construct a date column based on the existing columns Year, Month and Day.
For that, create the following custom calculated column:
[Year] & "-" & [Month] & "-" & [Day]
Then, change the data type of the newly created column to be date. The column should now contain date values in italic font:
7. Create the calculated columns for Sales in USD and Costs in USD
In the current table we can see there are columns for the sales quantity as well as price and costs per unit sold. Based on these columns we can calculate the total sales and costs per sales transactions. With these additional fields, we can later perform all the analysis required.
Create the following two additional columns:
[Sales quantity] * [Price per unit]
[Sales quantity] * [Costs per unit]
Change the data type for both new columns to decimal.
8. Remove columns not needed
Finally, we can remove the columns we do not need in the data model which are Year, Month and Day.
And that concludes our preparations for factSales.